

Measurement Window
Introduction
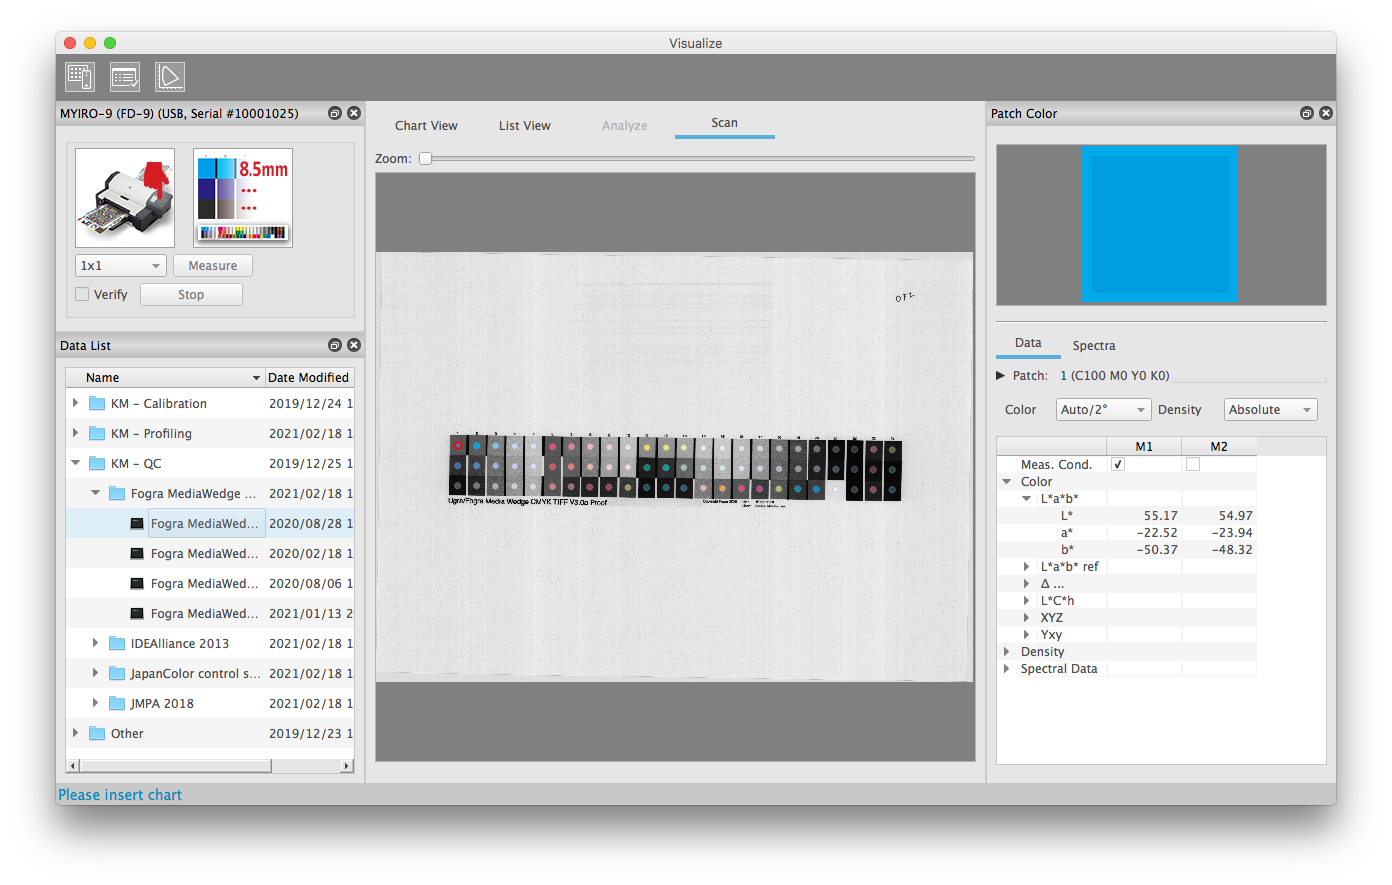
The measurement window (“Visualize”) is divided into several subwindows. These can be displayed and hidden and, if necessary, moved or separated from the main window. With the menu entry "Window -> Reset to Default" you can easily restore the default configuration.
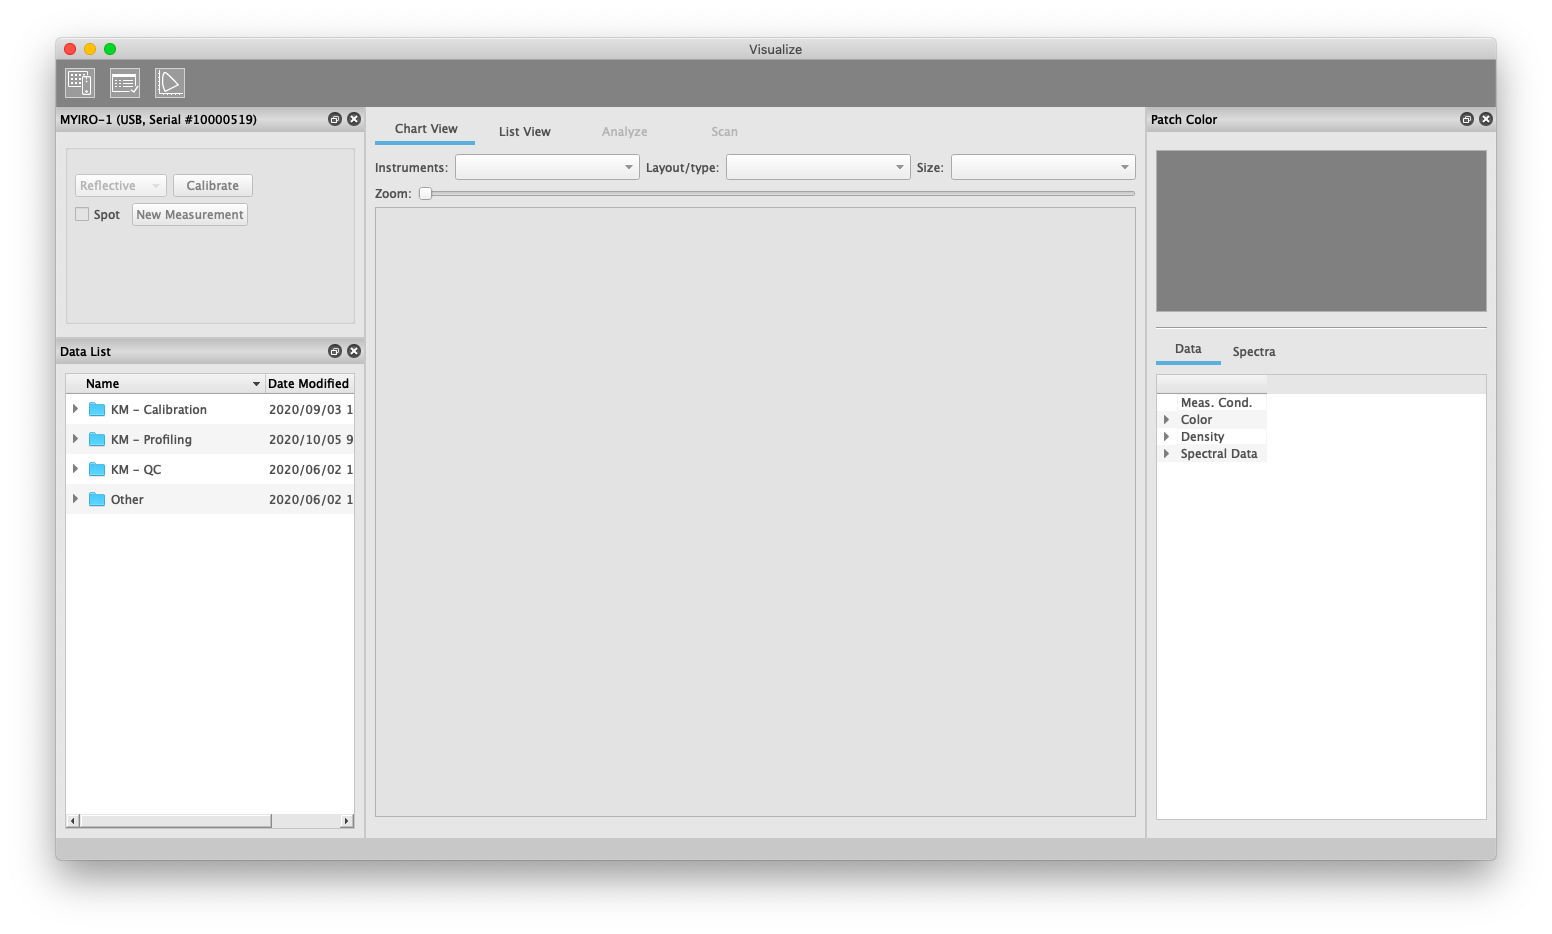
The default configuration provides a working direction from left to right::
- Left - Selection of the Data Set:
For a measurement, “Device Settings” and “Data List” first select measuring instrument parameters and the measuring folder including chart group. You can also select a measurement file directly to view existing data. - Center - Several Representations of the Data Set:
The main area in the center has several tabs, in which the data activated in “Data List” on the left is displayed in different ways:- Chart View
The chart is displayed here in the print layout. For a measurement, first select the chart details (“Layout/Type” and “Size”) on this tab and then perform the measurement. - List View
This view shows a list of the measured patches. It allows you to show and hide various measurement values, sort them in ascending and descending order according to selectable parameters and filter them according to field attributes. - Analyze
The Analyze tab shows the evaluation of the data set according to selectable criteria. - Scan
For MYIRO-9(FD-9) measurements, the scan including the measurement coordinates can be displayed here.
- Chart View
- Right - Data of a Single Patch from the Data Set:
The "Patch Color" window shows the details of the measurement field marked in the main area. For simple measurements, the parameters for measurement conditions, illuminant/observer, density status, etc. can also be selected here. If the "Analyze" tab is active, these parameters are taken over from the selected Analyze setting.
Toolbar
The toolbar has three icons in AccurioPro ColorManager
Measure | switches from viewing data to measurement it calls the dialog for connecting to a measuring instrument |
Analyze | Activates and deactivates “Analyze”: the “Analyze” tab is displayed, color differences from the reference are calculated |
Profiler | the active measurement dataset is transferred to the “Profiler” tool and the "Profiler" tool for entering the profile parameters is called |
Device Settings / Start and Stop Measurements
This window shows the most important instrument settings required during a measurement. They differ between hand-held instruments (MYIRO-1, FD-5BT, etc.) and the Auto scan spectrophotometer MYIRO-9(FD-9).
Handheld Instruments (MYIRO-1, FD-7 / FD-5BT, i1pro)
All three types of measuring instruments are capable of both spot and scan measurement and must be calibrated by the user. The “Device Setting” window therefore has the same operating elements for these instruments.
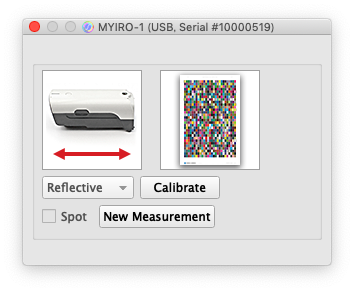

- AccurioPro ColorManager adapts to different working methods and therefore has several options for starting a new measurement with handheld instruments.
- During a measurement the button "New Measurement" changes to "Stop". Various control elements such as the selection of a measurement folder or the change of chart are then deactivated. Therefore, stop a running measurement with the "Stop" button before making a new measurement with another chart.
- As soon as the measurement is complete or has been stopped, this button is labelled "New Measurement" again. With this button, you can start the next measurement of the same chart without new chart selection while the window remains open.
- As an alternative to using the "New Measurement" button, you can also simply measure the first field or strip after selecting the measurement folder and the chart parameters. AccurioPro ColorManager then automatically creates a new measurement.
- More details on starting a new measurement and correcting existing measurement data can also be found below in DataList: Measurement folder marked => new measurement or Data List: Measurement file marked => Correction or repetition of a measurement.
- With this checkbox you can switch between spot measurement and scan measurement for strip readers. When selecting a chart, the recommended measurement mode for the connected device is automatically preset. A manual change is therefore usually not necessary.
- While the MYIRO-9(FD-9) is automatically calibrated, this must be done by the user for hand-held measuring instruments. For larger charts, one calibration per chart page is recommended. Use the "Calibrate" button to trigger a new calibration if necessary. The calibration procedure for the various instruments is described above in Calibration of Instruments.
- AccurioPro ColorManager is designed for calibration of Konica Minolta AccurioPress. The "Reflective" measuring mode is therefore preset for all charts and measuring instruments.
MYIRO-9(FD-9)
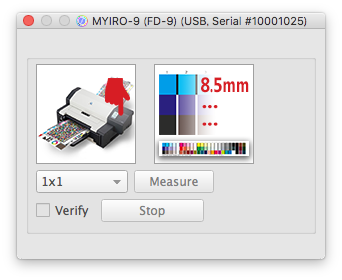
- The MYIRO-9(FD-9) can automatically measure several times in one patch. This allows the size of the evaluated area to be controlled similarly to an adjustable aperture.
- If the printed patches are large enough, the following virtual apertures result:
- Measurements: Diameter of the virtual aperture
- 1x1: approx. 3 mm
- 2x2: approx. 6 mm
- 3x3: approx. 9 mm
- 4x4: approx. 12 mm - The setting "Auto" selects the maximum meaningful number of measurements depending on the patch size of the selected chart. This setting should only be selected if you really want to evaluate the maximum possible area - e.g. for coarse prints or heavily structured surfaces. Multiple measurements can greatly increase the measurement time for large patches.
- If patch recognition verification is enabled (check box “Verify”), AccurioPro ColorManager first displays the scan with the detected measurement positions before the measurement and waits for confirmation from the user. This allows you to check whether measurements are being made at the correct positions and then start the measurement by clicking the "Measure" button.
- This function is mainly intended for charts that are measured with the coordinate mode (fixed coordinates related to the upper and left paper edge => exact edge trim necessary). This function can also be helpful for printouts where it’s difficult for the patch recognition to find the chart on the sheet due to many interfering elements.
- This function is disabled for standard charts. The MYIRO-9(FD-9) then starts the measurement fully automatically after successful pattern recognition. It is then also possible to check the measuring positions, but only after the measurement if necessary.
- With this button a measurement can be stopped prematurely. With one-sided charts, the stop also deletes the temporarily created measurement file, since the smallest measurement unit for the MYIRO-9(FD-9) is one page. Saving half a page does not make sense with the MYIRO-9(FD-9), since the whole page must be measured again when continuing the measurement.
- With multi-page charts, however, an incomplete data set is saved if at least one page has been completely measured. So you can load this dataset later and continue the measurement.
Data List
The "Data List" window shows the folders in which the measurement data are created. The corresponding data are located in the working folder under [active working folder]\Data\Tool\Measure\... .
Storage location of the measurement data:
The .mdl raw measurement files are stored in the measurement folders. Depending on the task, various CGATS format user data can be exported on this basis. Details on the raw measurement data concept and data export can be found in Data Export and Printing.
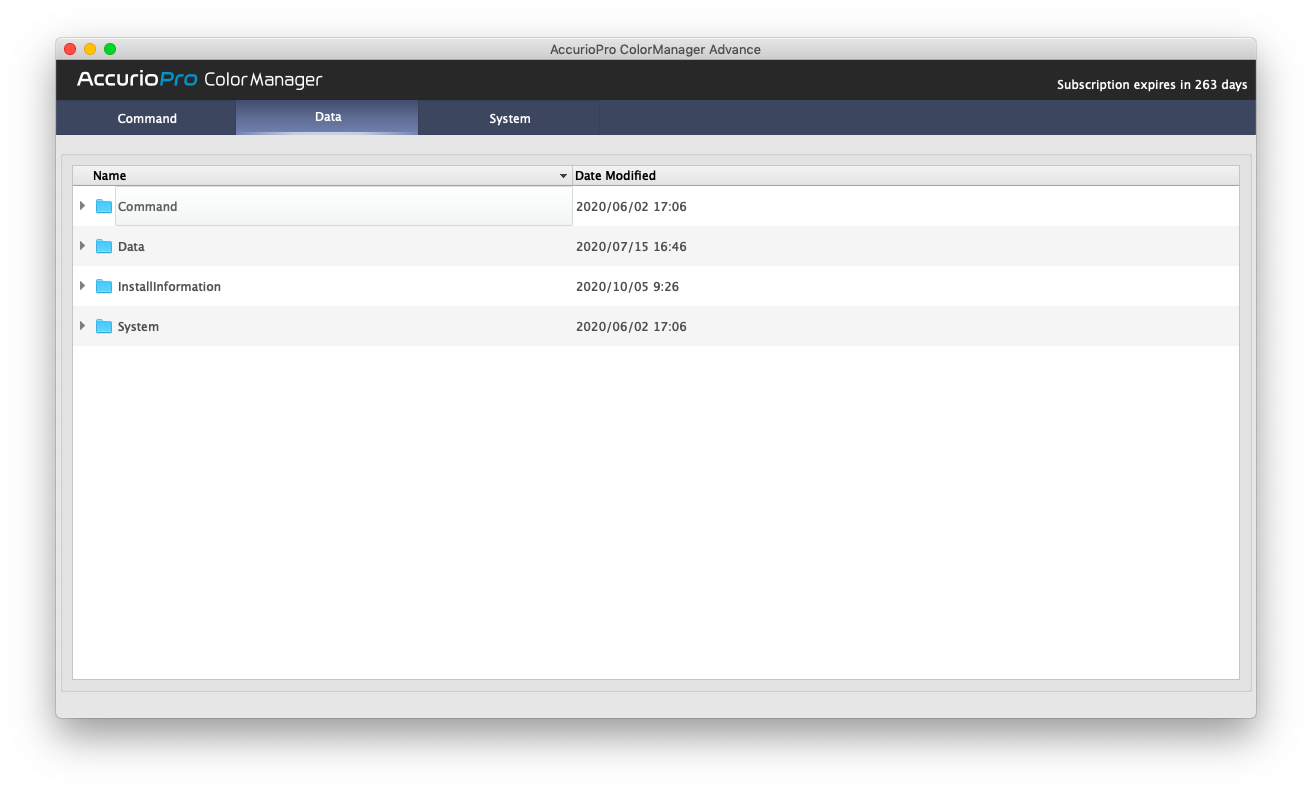
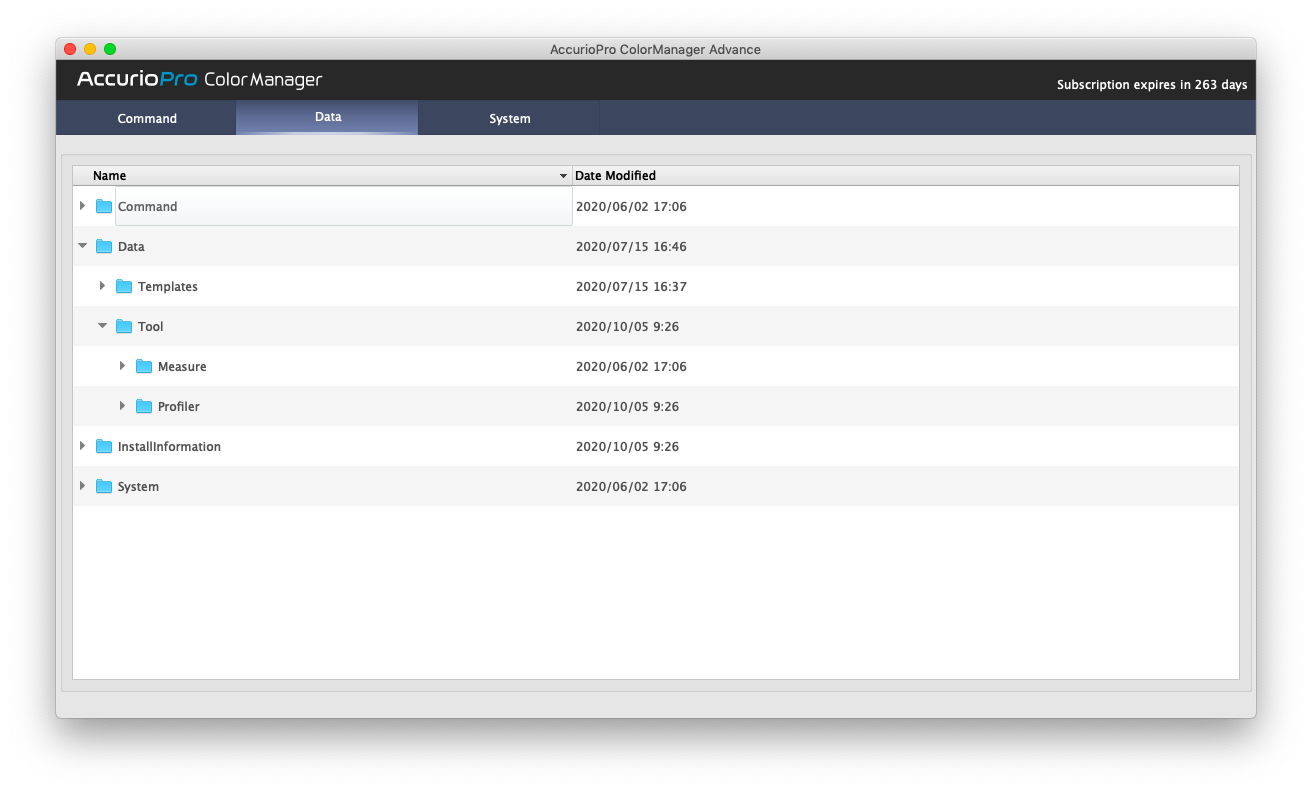
Measurement data: sorting, renaming, deleting and exporting
Measurement files have the name format "[Measurement file name]_[Measurement number].mdl".
The measurement data are numbered automatically, the measurement number has five digits and is increased by one with each new measurement.
In addition, the Data List window displays the date/time of the measurement file. You can sort the list by measurement file name or date/time.
The default for the first measurement in the measurement folder is the folder name. However, you can easily change the names at any time. To do this, right-click on a measurement and select "Rename" from the context menu after selecting the desired measurement from “Data List”. This makes it very easy to mark measurement series with corresponding names within a folder. Change the name of the first measurement of a measurement series. The measurement file name is used for the following measurements and a measurement number is automatically added if necessary.
The context menu (right click on a .mdl measurement file selected from the “Data List”) also contains entries for deleting a measurement file or exporting a CGATS file (details on export: see Data Export).
Measurement files can be named as desired, but the names of the pre-installed folders under "[active working folder]\Data\Tool\Measure\..." must not be changed, since workflows access these measurement folders. Therefore, no context menu appears when right-clicking on a folder.
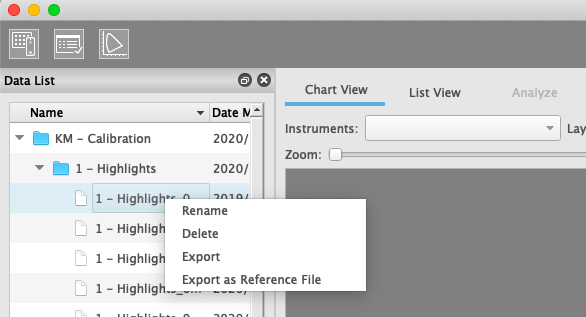
Selection of a measurement folder
If you click on a measurement folder, a view of the chart and, if applicable, chart selection parameters appear in the middle of the measurement window on the "Chart View" tab. For pure organization folders, the center area is empty (or only shows a folder symbol). Before the measurement, select a measurement folder with the desired chart.
Measurement folder with several chart layouts
A measurement folder usually contains data for the same purpose. However, the intended purpose is not necessarily linked to a single chart layout. For example, a profiling chart can have several graphical layouts for different measuring instruments and paper formats. A classic case is profiling standard charts, which contains color patches with fixed CMYK values, but is available in many different layouts. The measurement files that are generated with it are therefore always the same and can be easily compared with each other, although the layouts of the measured prints sometimes differ greatly.
Therefore, each measurement folder of AccurioPro ColorManager can contain several versions of a chart. The selection is made in the center main area of the measurement window in the tab "Chart View".
The chart selection automatically takes the connected measuring instrument into account. This means that you can only select charts that can be reliably measured with your instrument. If the measuring device for the selected chart has to be switched to a certain measuring mode (e.g. spot measurement for very small measuring patches), this is usually also done automatically with the chart selection.
The chart with which it was created is stored in a measurement file. Therefore, the chart selection parameters can only be changed if you click on a measurement folder to perform a new measurement, but not if you select an existing measurement.
Further details on the chart selection parameters can be found in the description of the "Chart View" tab.
Measurement Window Main Area - Chart View
The main area in the center has several tabs in which the data set selected in the “Data List” window or the chart is displayed in different forms.
In the "Chart View" tab, the chart is displayed in the print layout. This tab is also the user interface for performing measurements. The available controls differ slightly depending on whether a measurement folder or a measurement file is selected in the "Data List" window.
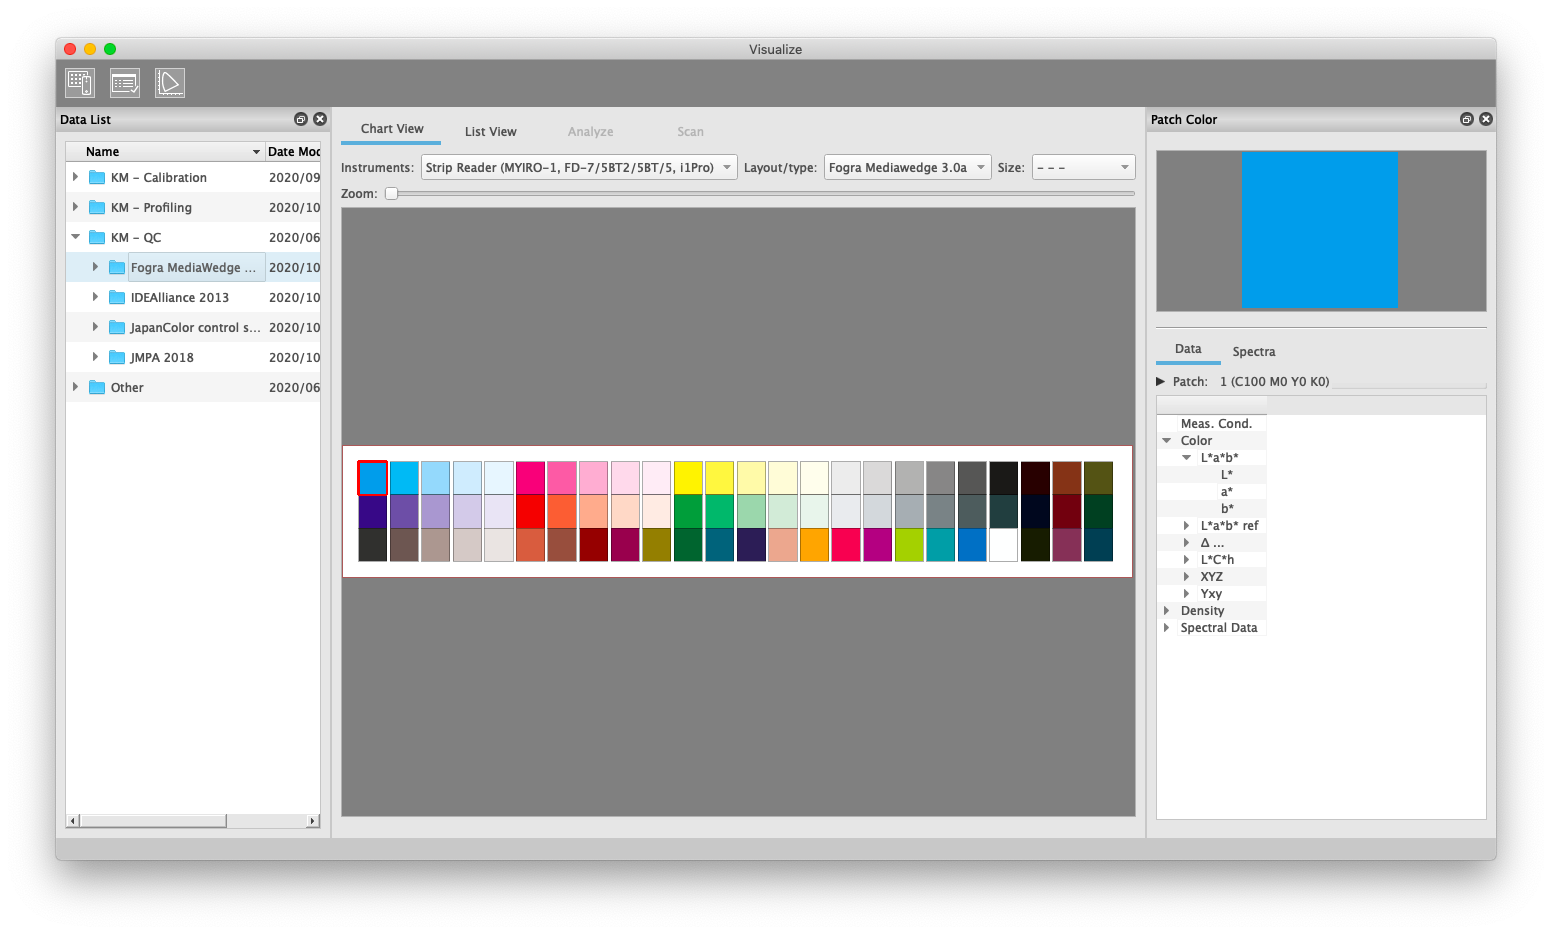
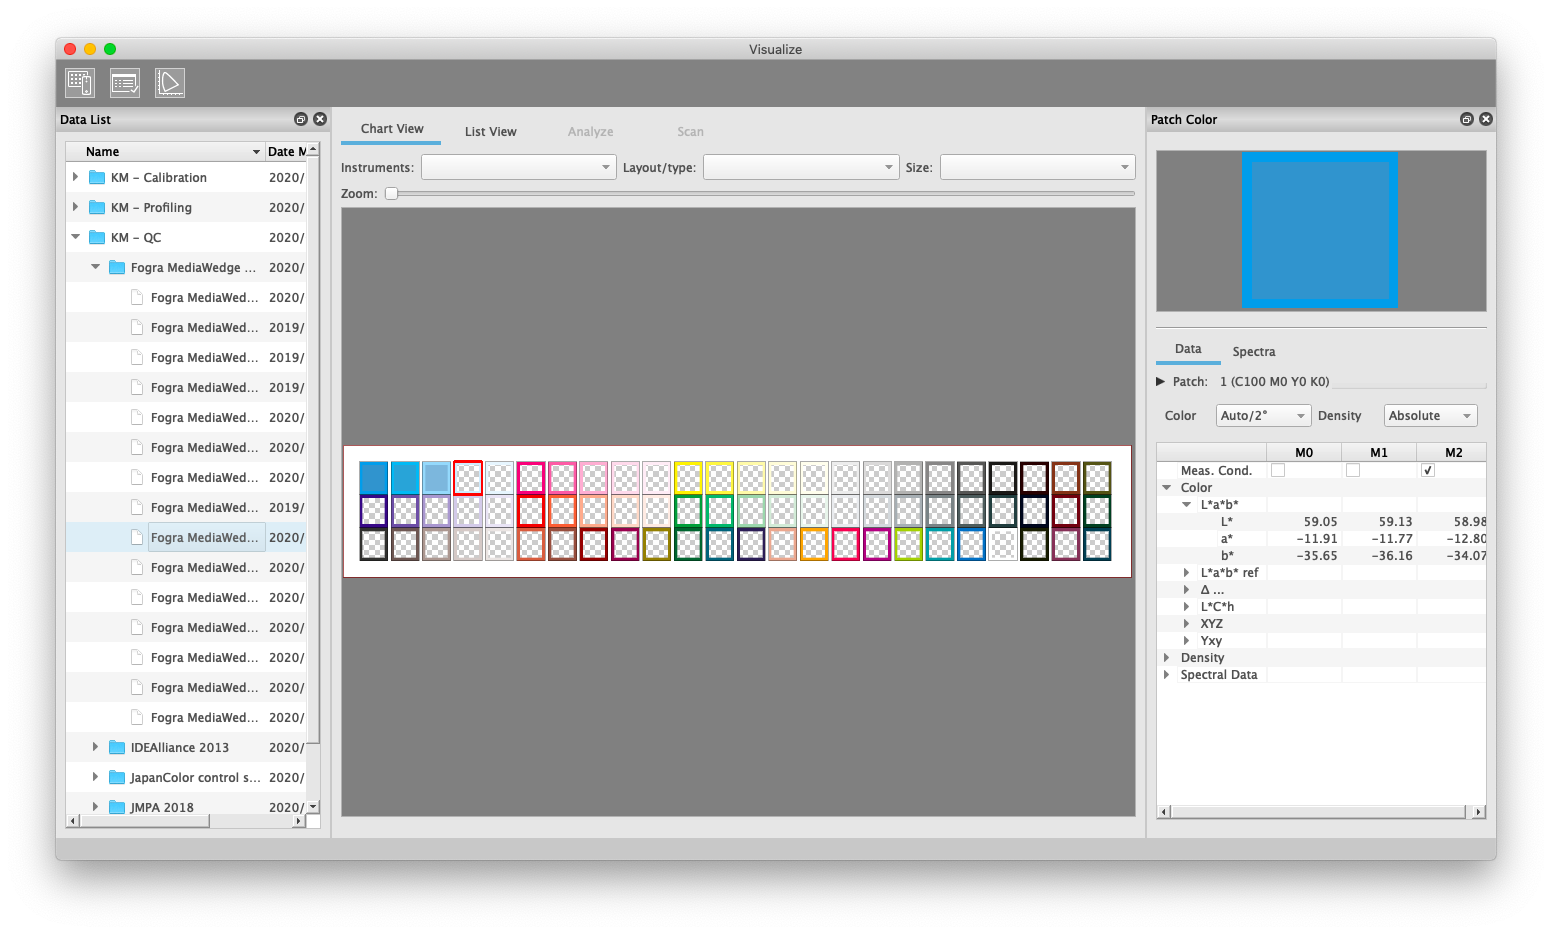
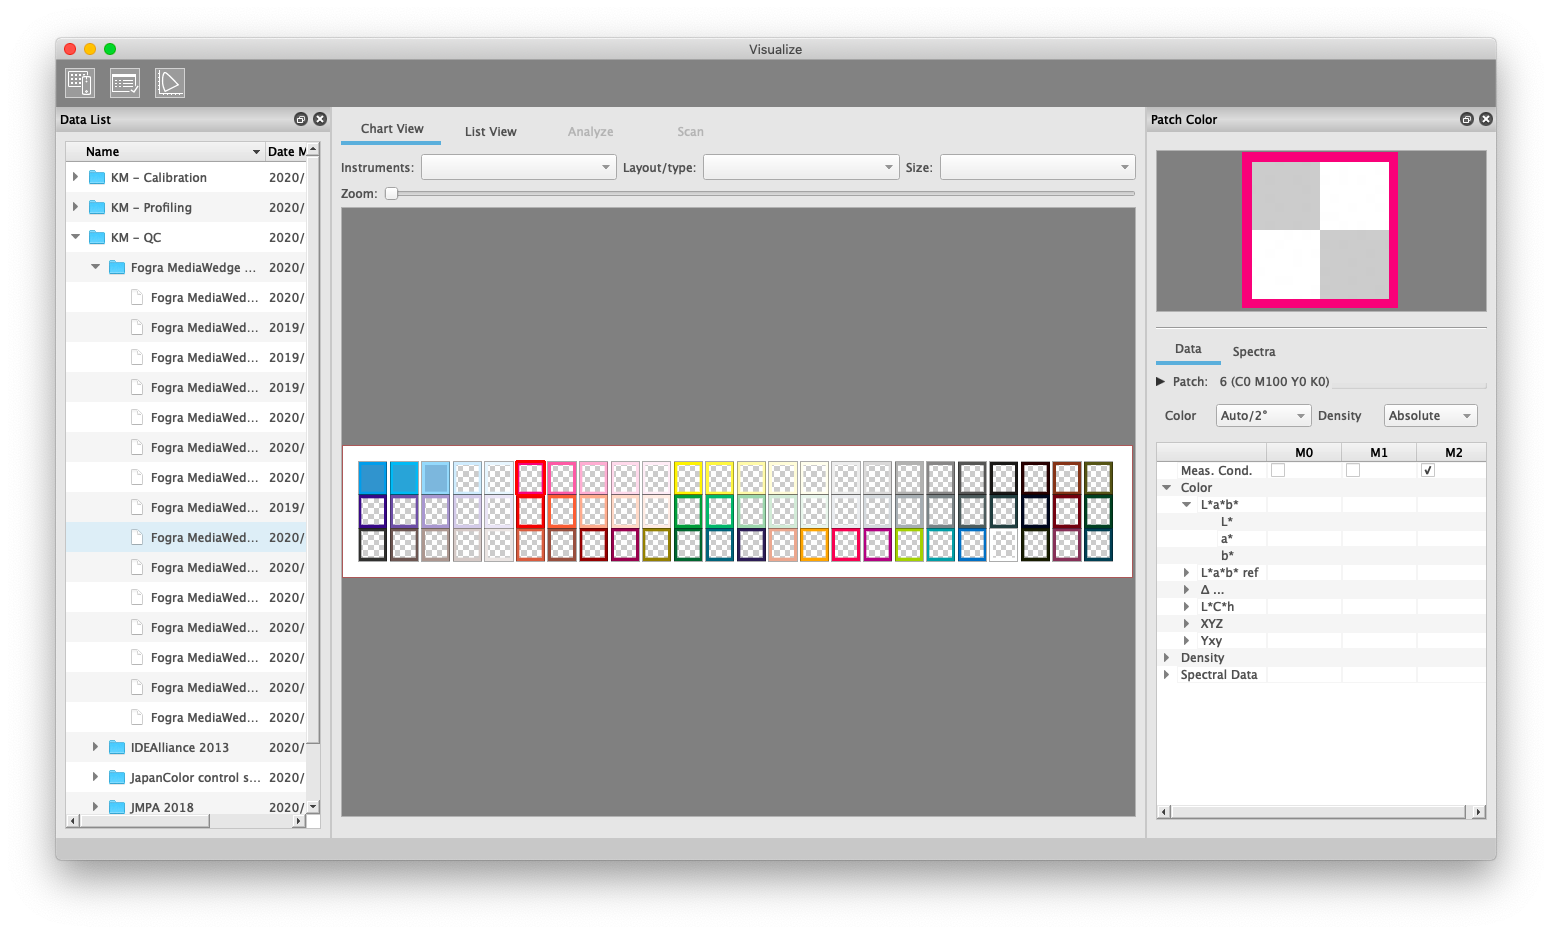
There are basically three patch representations:
Chart-Definition | unicolored color fields |
Measurement data | outer frame: expected color (definition / reference) |
Empty Measurement | outer frame: expected color (definition / reference) |
DataList: Measurement folder marked => new measurement
When you select a measurement folder in the Data List window, the Chart View displays the chart(s) it contains. If a measurement folder is selected, AccurioPro ColorManager assumes that you want to create a new measurement file.
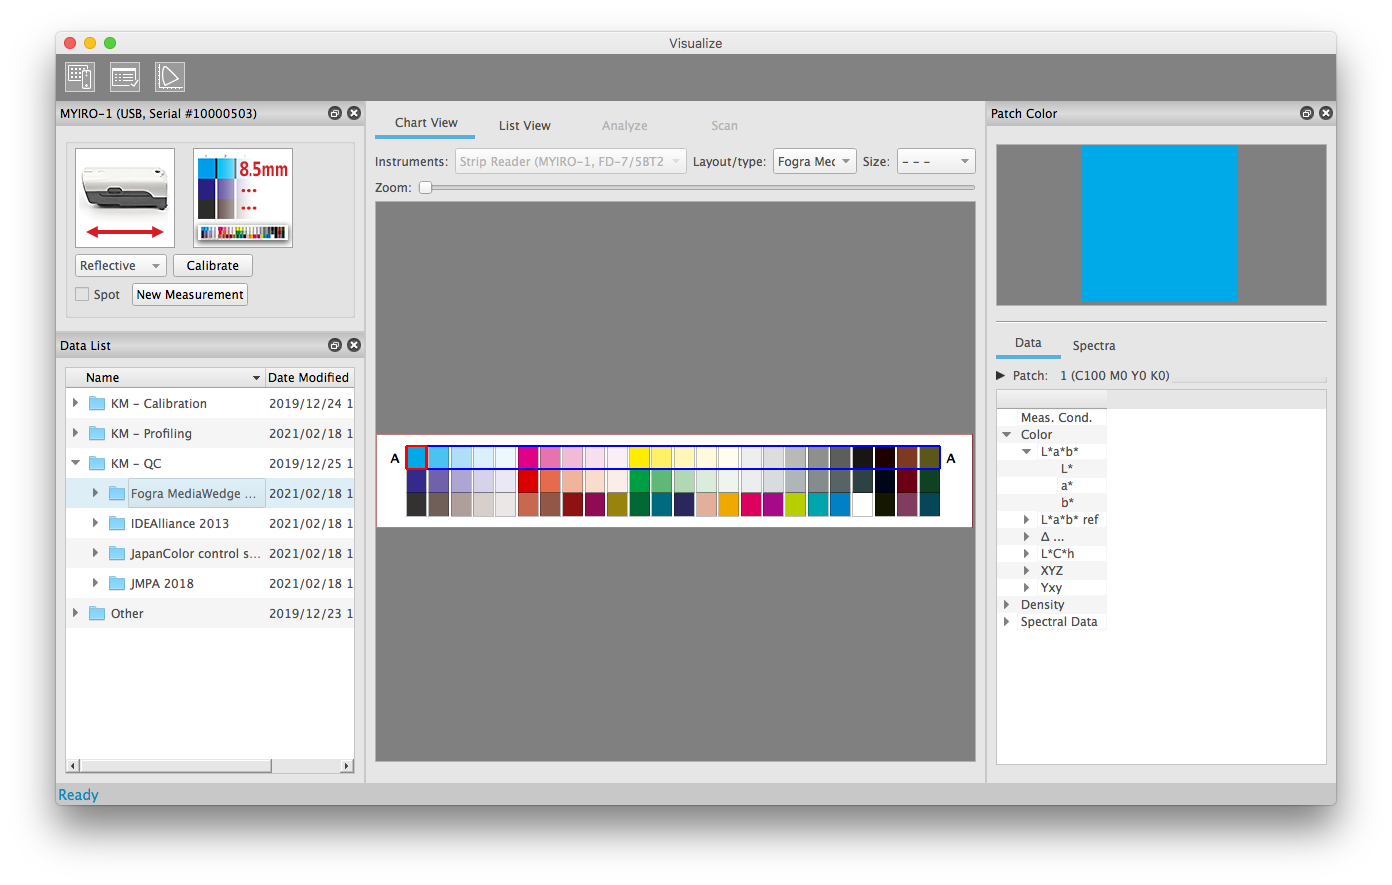
To keep the folder structure for the data clear, AccurioPro ColorManager allows multiple charts in a measurement folder. The only decisive factor is that measurement data in a measurement folder should serve the same purpose. If a measurement folder now contains several charts, a three-level selection for the chart parameters appears in the “Chart View” tab.
1) Instrument | The instrument type is selected here. Measuring instruments with the same requirements for the charts are combined into one group (e.g. strip reader MYIRO-1, FD-7/5BT, i1pro). |
2) Layout/Type | The MYIRO-9(FD-9) can, for example, basically be used for more different chart layouts than the stripe readers. Therefore, the list of layouts may vary depending on the type of instrument selected. |
3) Size | Charts for the same encoder type and the same layout type can now still be available for different paper sizes. |
When you click on a measurement folder in the “Data List” window, the most frequently used chart selection parameters are automatically preselected. Change the parameters according to your requirements.
After all the three parameters have been selected, the chart is set for the next measurement. Now start your measurement.
Strip reader | Click on "New Measurement" in the "Device Settings" window. or simply measure the first field or strip. |
MYIRO-9(FD-9) | Insert the first page of your chart into the MYIRO-9(FD-9). |
As described above, a new measurement file will be created.
If you want to perform another measurement with the same chart, click on "New Measurement" for strip readers after the measurement.
With the MYIRO-9(FD-9), simply push the next print into the device.
Data List: Measurement file marked => Correction or repetition of a measurement
A .mdl measurement file contains the information with which chart definition the measurement was performed. If you select a measurement file in the Data List window, the chart definition is automatically defined as well. Therefore, the chart selection parameters cannot be changed in this case.
Note
- The spectrophotometer used when creating original measusrment data was created is kept after correcting of the measurement by using other spectrophotometer. So the spectrophotometer information is not ignored after correction. A used spectrophotometer can be found in a exported mesurment file, e.g txt file.
- Mixed measurment between "MYIRO-9(FD-9), FD-7, FD-5BT, MYIRO-1" and "i1Pro, i1Pro2" is not allowed in this software. Therefore, on Tool Measure, correctable measuement data listed in Data List will be only displayed.
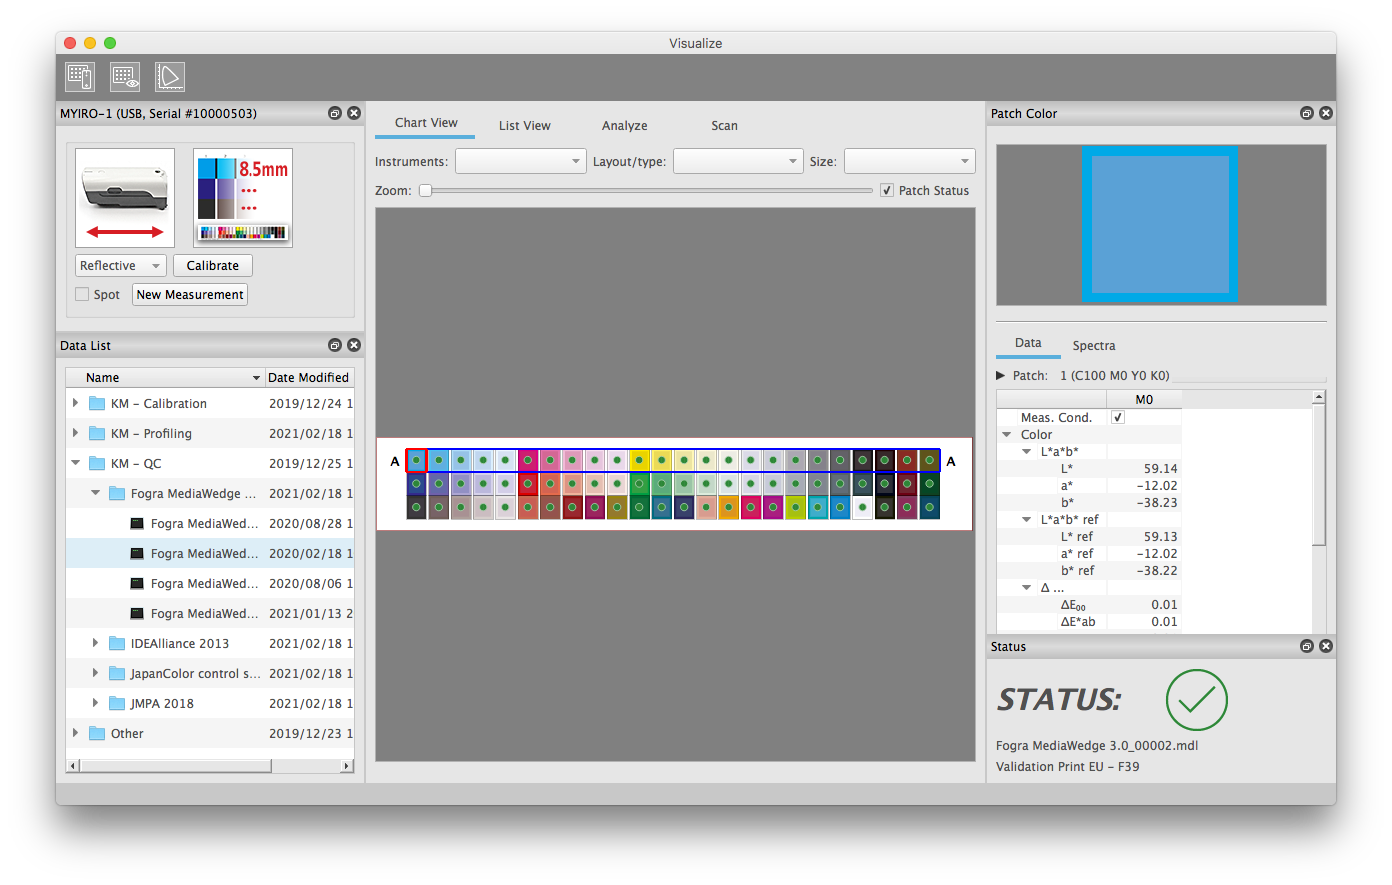
If you select a measurement in the “Data List” window and then start a measurement, the program assumes for strip readers and MYIRO-9(FD-9) in single sheet mode that the measurement is to be corrected or repeated and opens a corresponding dialog.
Operator errors can occur with hand-held measuring instruments (e.g. incorrect strip sequence). Even with the MYIRO-9(FD-9)'s single-sheet operation, operator errors are still possible (e.g. mistaken sheets in multi-page charts). Therefore, the correction of a measurement file is intended for these devices.
If, on the other hand, the MYIRO-9(FD-9) is operated in the Auto Sheet Feeder, such a dialog would interfere with the measurement process. The measuring device is very fast, the measuring sequence is fully automated even for multi-page charts. Operator errors are therefore almost impossible. Therefore, the correction of measurement data does not make sense in practice. Incorrect data (e.g. caused by printing errors) are simply deleted and completely re-measured.
With the MYIRO-9(FD-9) with Auto-Sheet-Feeder, a new measurement file is therefore always created automatically when a new chart (or the first page of the chart) is fed in.
Strip Reader: | A dialog with the following options appears: overwrite existing file with new measurement data create a new measurement file cancel |
MYIRO-9(FD-9) without ASF*: | like strip reader |
MYIRO-9(FD-9) with ASF*: | automatic creation of a new measurement file: no correction of existing measurement data Incorrect measurement data (e.g. due to printing errors)) are simply deleted and completely remeasured |
*ASF: Auto Sheet Feeder
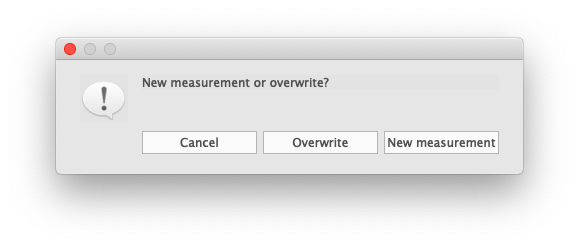
Summary: Measurement with Strip Readers
Depending on your objectives, select a measurement folder or a measurement file in the “Data List2 window. With strip readers, you can create a new measurement file by measuring the first field/strip or using the "New Measurement" button.
- Select measurement folder in the “Data List” window
- Select Chart parameters in the "Chart View" tab.
- Measure the first field or strip of the print.
The measurement automatically creates a new empty measurement file. A click on the "New Measurement" button is not absolutely necessary for the first measurement.
- Select measurement folder in the “Data List2 window
- Select Chart parameters in the "Chart View" tab.
- Press the "New Measurement" button in the "Device Settings" window
The button "New Measurement" is mainly intended to perform several measurements of the same chart one after the other. Of course, you can also use this button to start your first measurement.
- Select measurement file
- measure a field or a strip of print
With this action, a dialog with the following options appears first:
• overwrite existing file with new measurement data
• create a new measurement file
• cancel
The chart has already been preselected via the measurement file. Therefore, the chart selection parameters cannot be changed in this case. This procedure is mainly intended for the correction of measurement data.
- Select measurement file
- Press the "New Measurement" button in the "Device Settings" window
As with 2), a new measurement is created. The chart definition is now taken from the previously marked measurement file. The chart selection parameters are therefore already selected and cannot be changed.
Summary: Measurement with MYIRO-9(FD-9) without Auto-Sheet-Feeder
Depending on your objectives, select a measurement folder or a measurement file in the “Data List” window. The workflow is largely similar to that of hand-held instruments.
You start a measurement by inserting a printout into the MYIRO-9(FD-9). A separate "New Measurement" button is therefore not necessary.
At the end of a measurement, the measurement file is active and the measurement data are displayed. If you now insert a new print sheet, a dialog appears in which you can choose whether you want to create a new measurement or overwrite the old measurement.
Alternatively, you can select the measurement folder again before inserting the print. A new measurement file will then be created automatically without prompting.
Summary: Measurement with MYIRO-9(FD-9) with Auto-Sheet-Feeder
When the MYIRO-9(FD-9) is operated in an Auto Sheet Feeder, extensive series measurements are usually required.
In this case, when the first page of the chart is inserted, a new measurement file is always created automatically, regardless of whether a measurement folder or a measurement file is selected.
Measurement Window Main Area - List View
This tab displays the chart data in the form of a list. Here you can show and hide various data, arrange the columns according to your needs and sort and filter your data.
Transfer of measurement data to other programs
If, for example, you want to process your data in a spreadsheet, you can first view and sort it here and then copy/paste it to other programs via the clipboard. Make sure that the decimal separator in your spreadsheet is configured correctly. AccurioPro ColorManager uses a dot as decimal separator as required for CGATS file format.
Displaying data / Showing and hiding columns
To do this, right-click the header of the list. You can now select the data to be displayed in the context menu.Please note that the first column "Patch" for displaying the color is permanently preselected, is always displayed and therefore cannot be clicked.
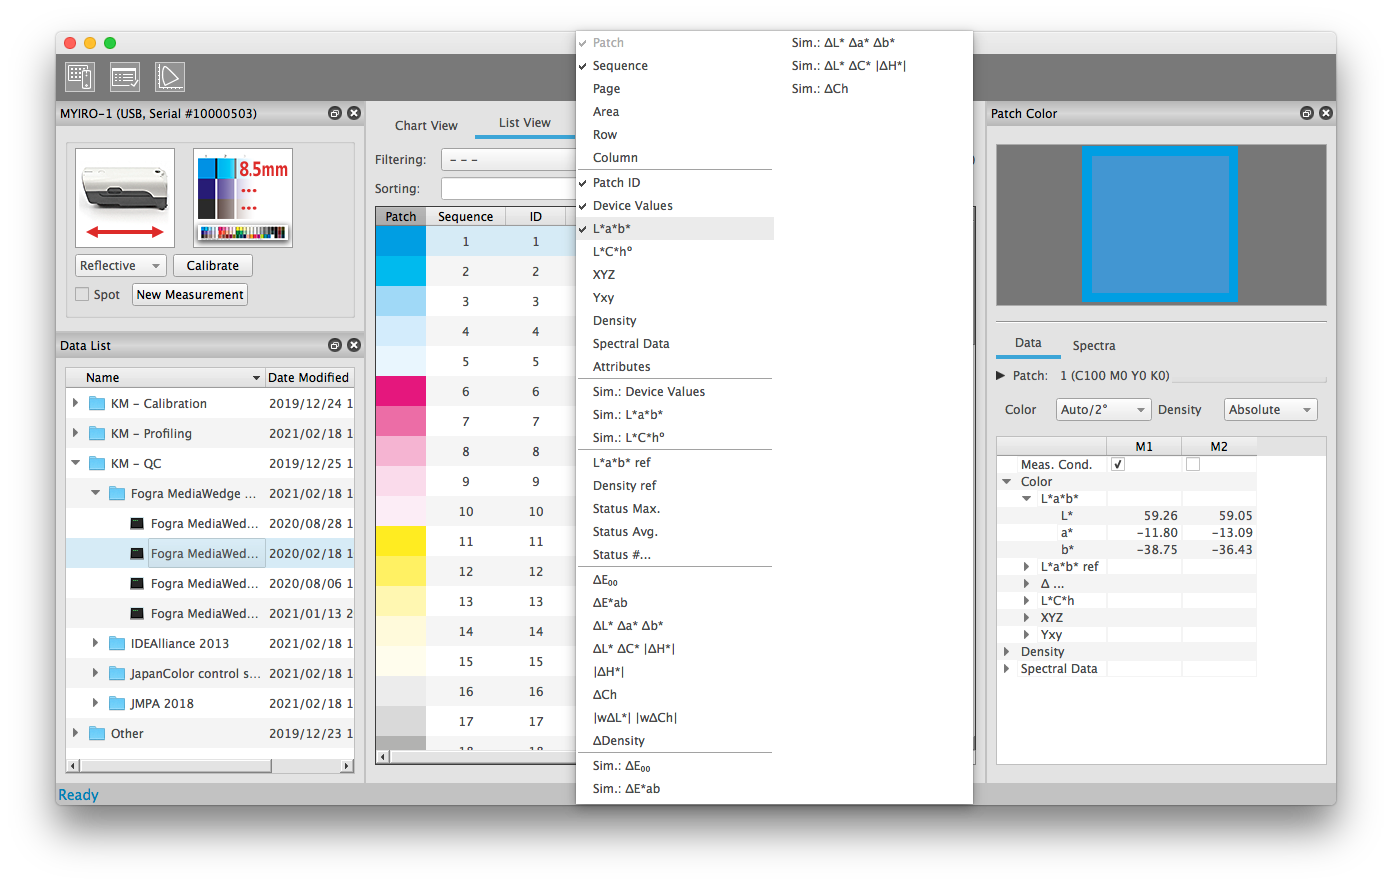
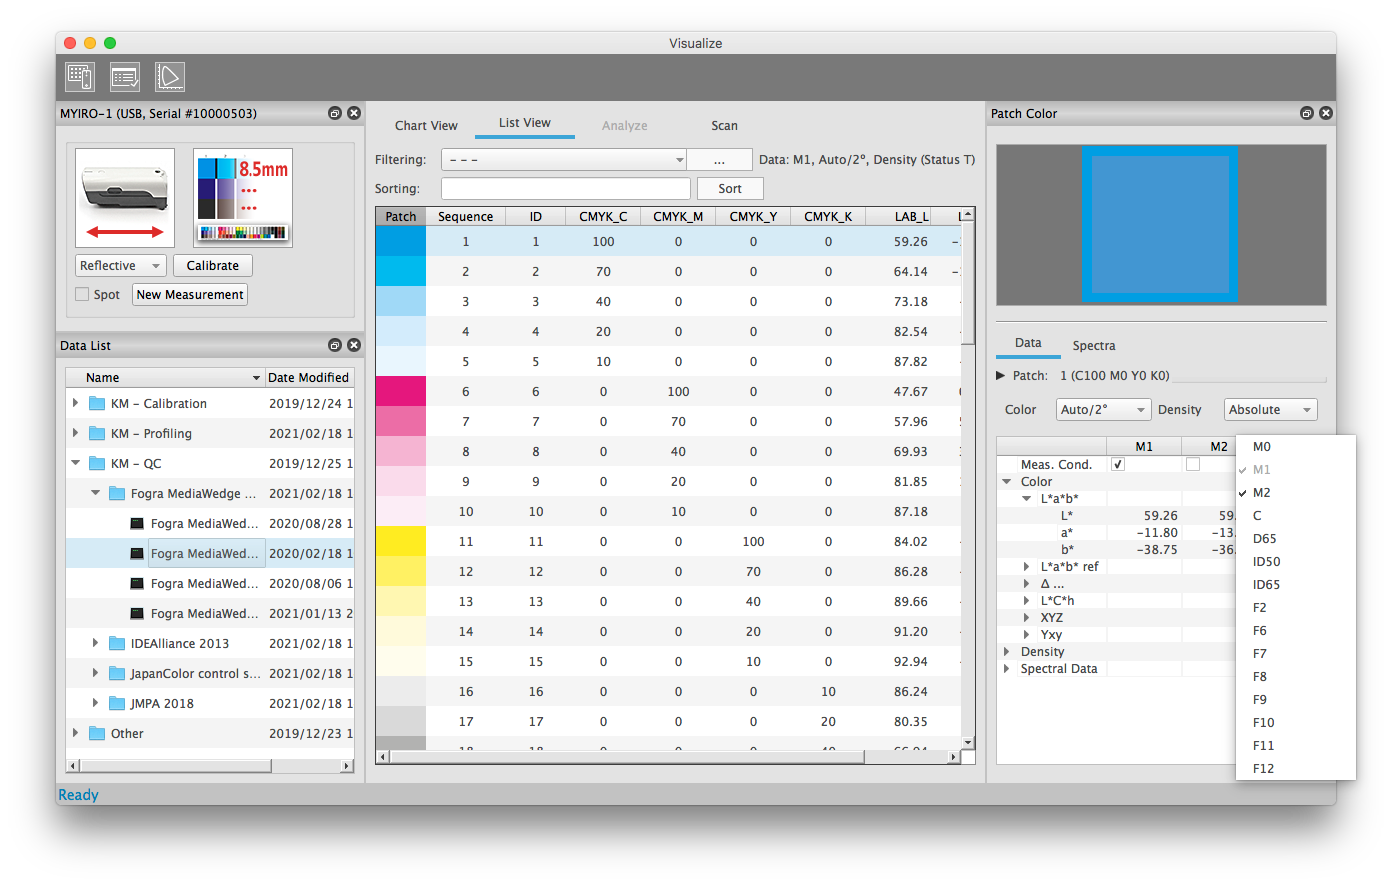
For a measurement, the “List View” tab shows the patch definition and measured values of the patches. Colorimetric measurement values are displayed with the measurement condition and an illuminant/observer setting. You select the primary color value setting for the List View in the "Patch Color" window. Here you can also compare several measurement conditions for single color patches.
If you have activated the "Analyze" tab and a measurement is selected, color difference values are also calculated. These can then also be displayed in the List View. If the tab "Analyze" is switched off, the corresponding columns are empty.
Arranging/moving columns
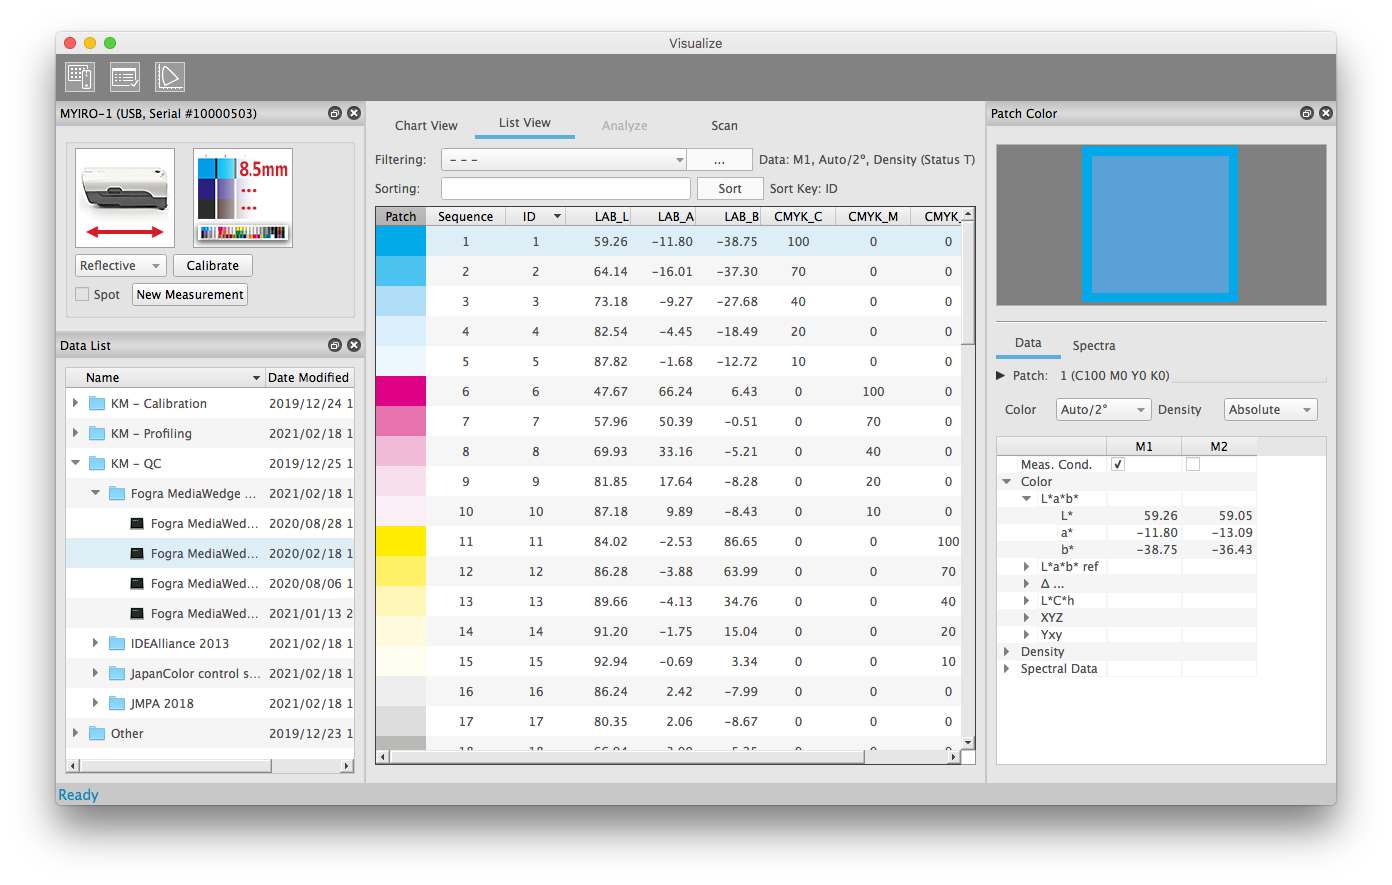
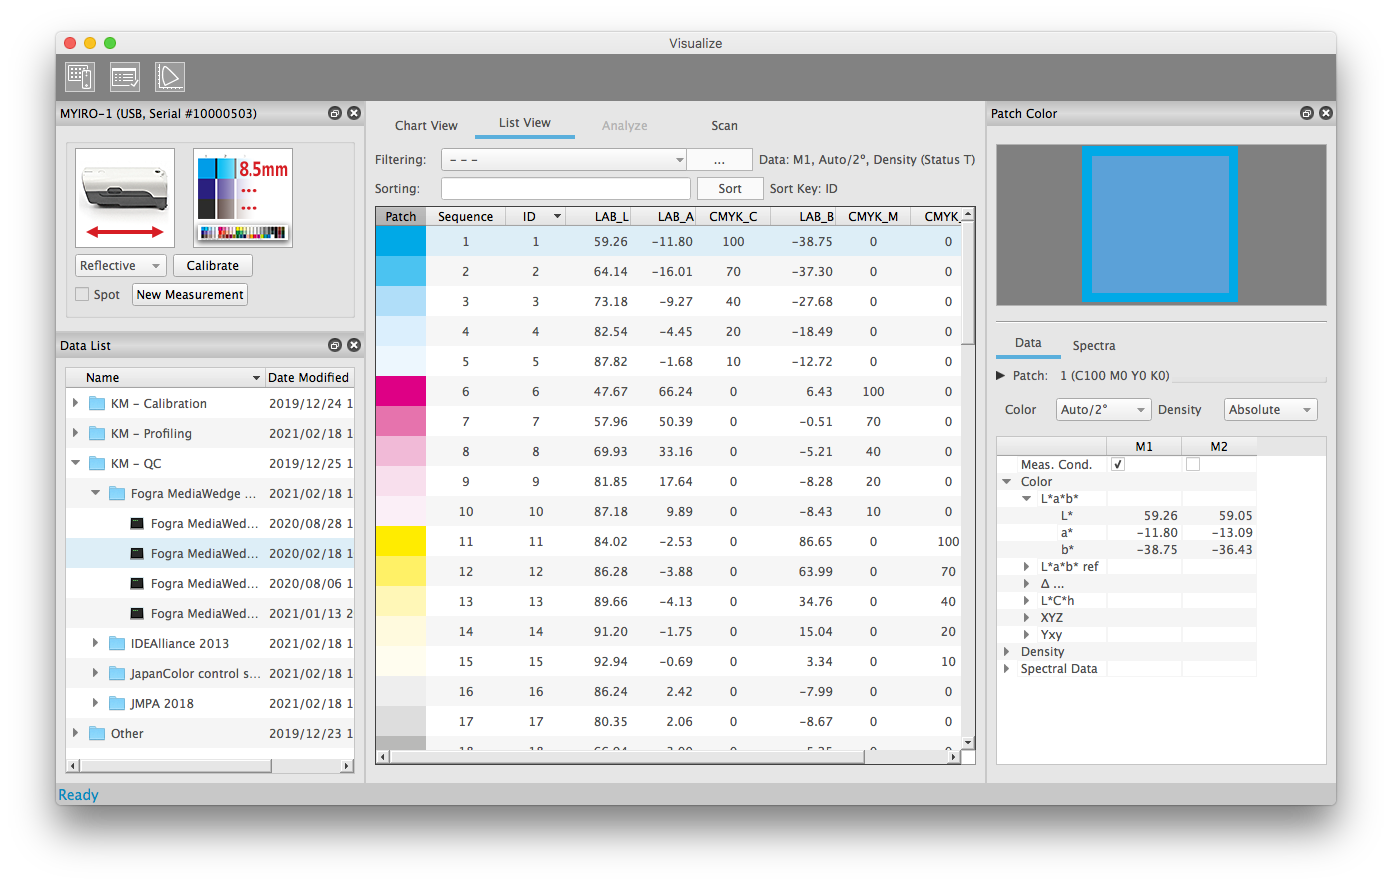
You can arrange the columns in the “List View” according to your requirements. Simply drag and drop the columns to the desired position.
Move entire color systems (Device Values, L*a*b*, XYZ,):
If an entire color system (e.g. L*a*b*) is to be moved, make sure that the columns are arranged in the standard order (e.g. ...| L* | a* | b* |...). Now click on the first column (in the example L*a*b* on the L* column) and drag it to the desired position. The corresponding columns of the group (in the example L*a*b*: columns for a* and b*) are automatically moved as well.
Moving individual columns of a color system:
You can also ungroup a color system. To do this, simply drag one of the other columns to a new location instead of the first column (in the example L*a*b*: columns a* or b*). This ungroups the columns. Now you can move all columns of a color system individually. To restore a grouping, simply return the columns to the default order next to each other. Now you can move the entire system again with the first column.
Sorting data
If you simply click on a column, the data will be sorted by that column in ascending order. Click again to sort in descending order.
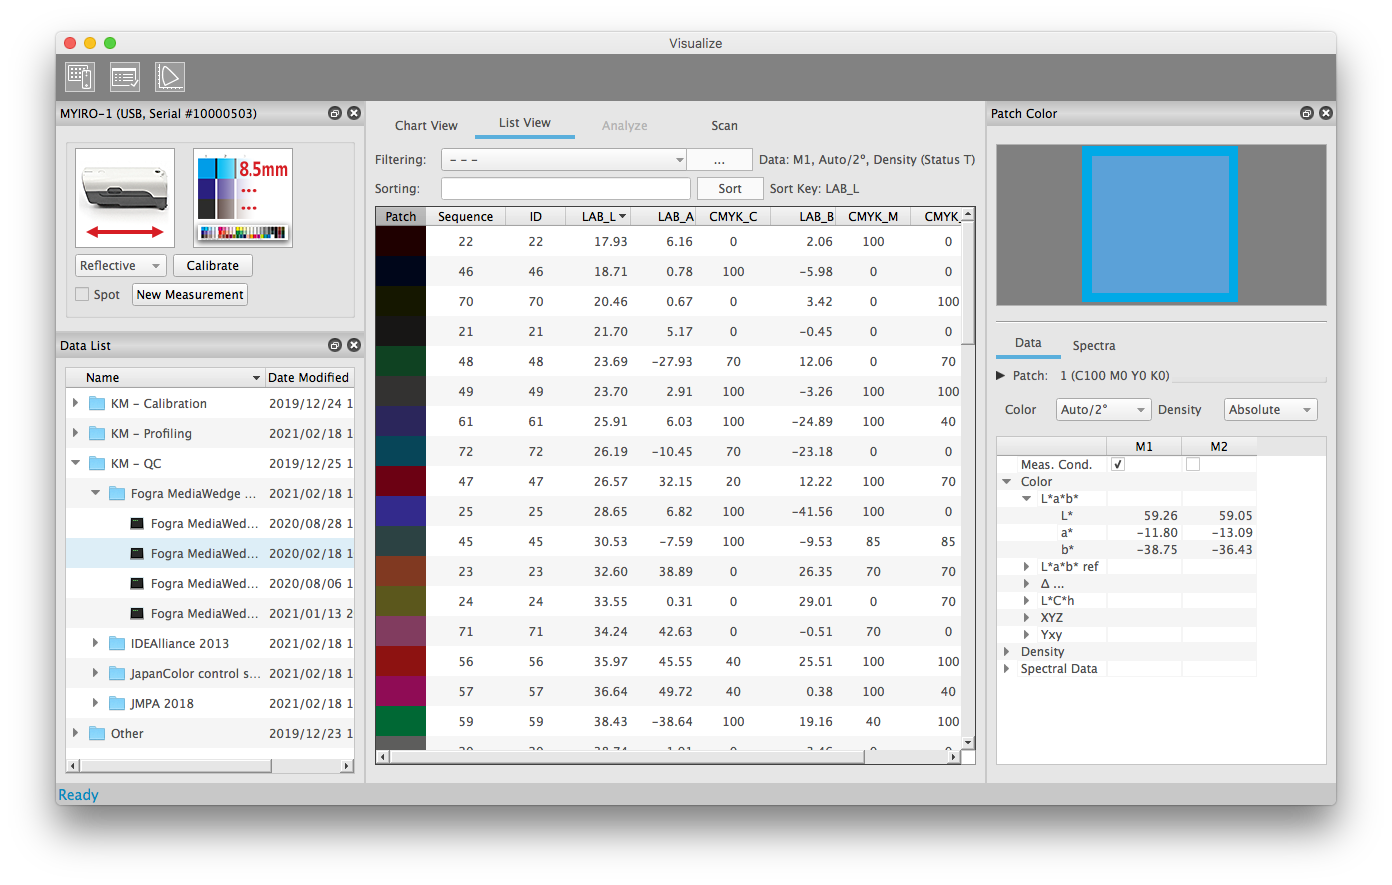
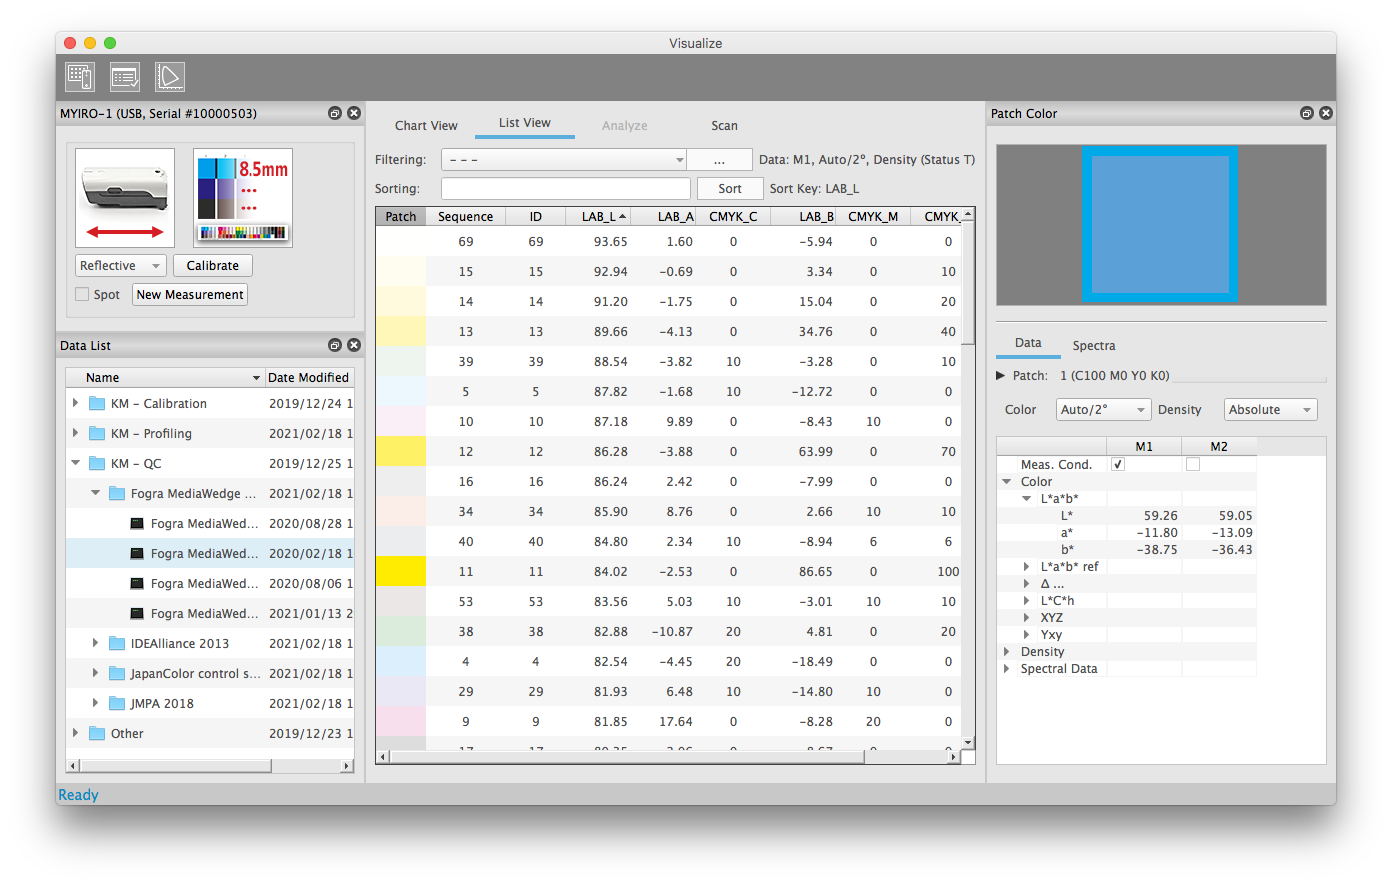
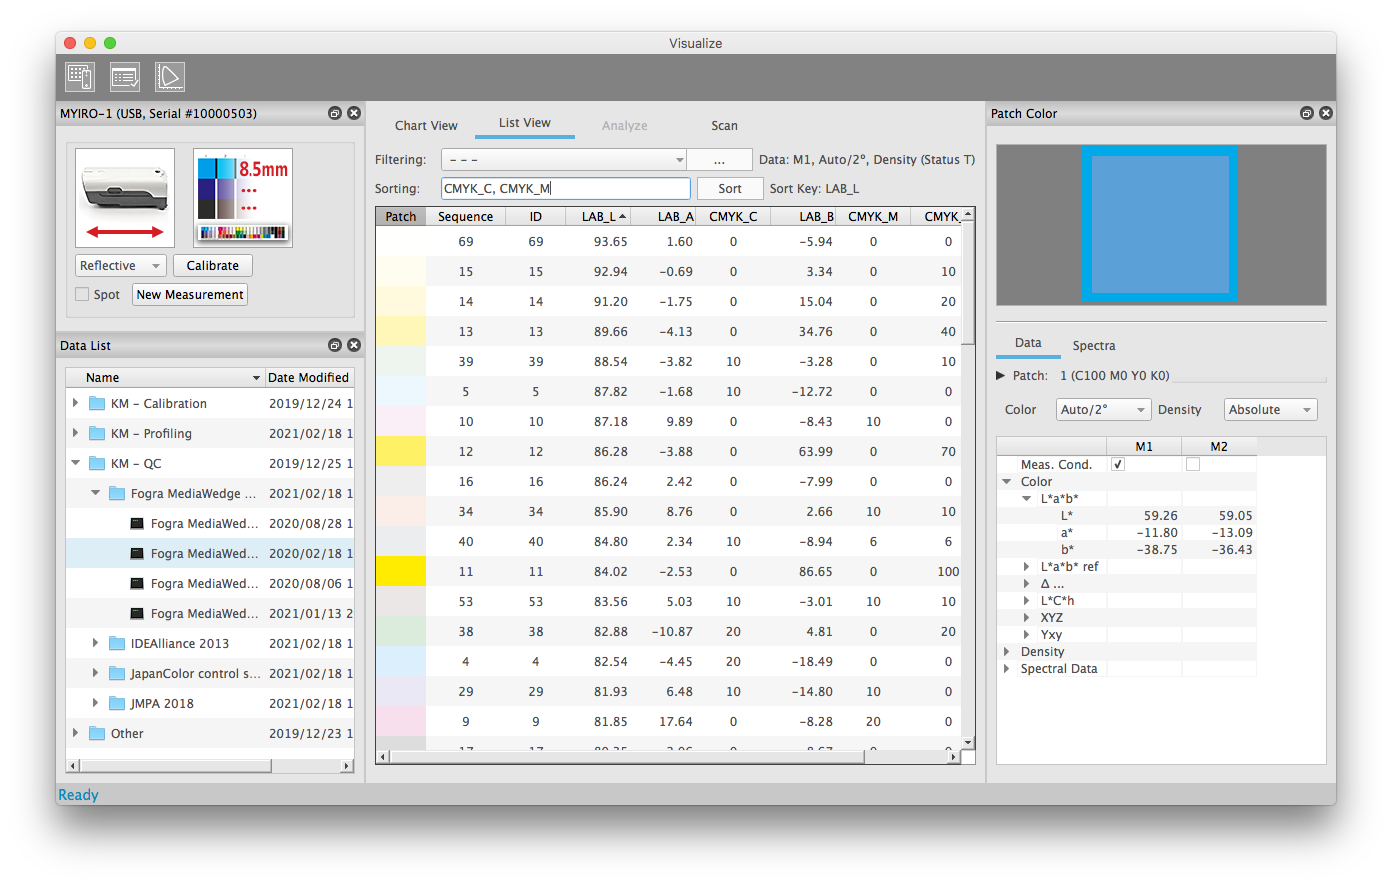
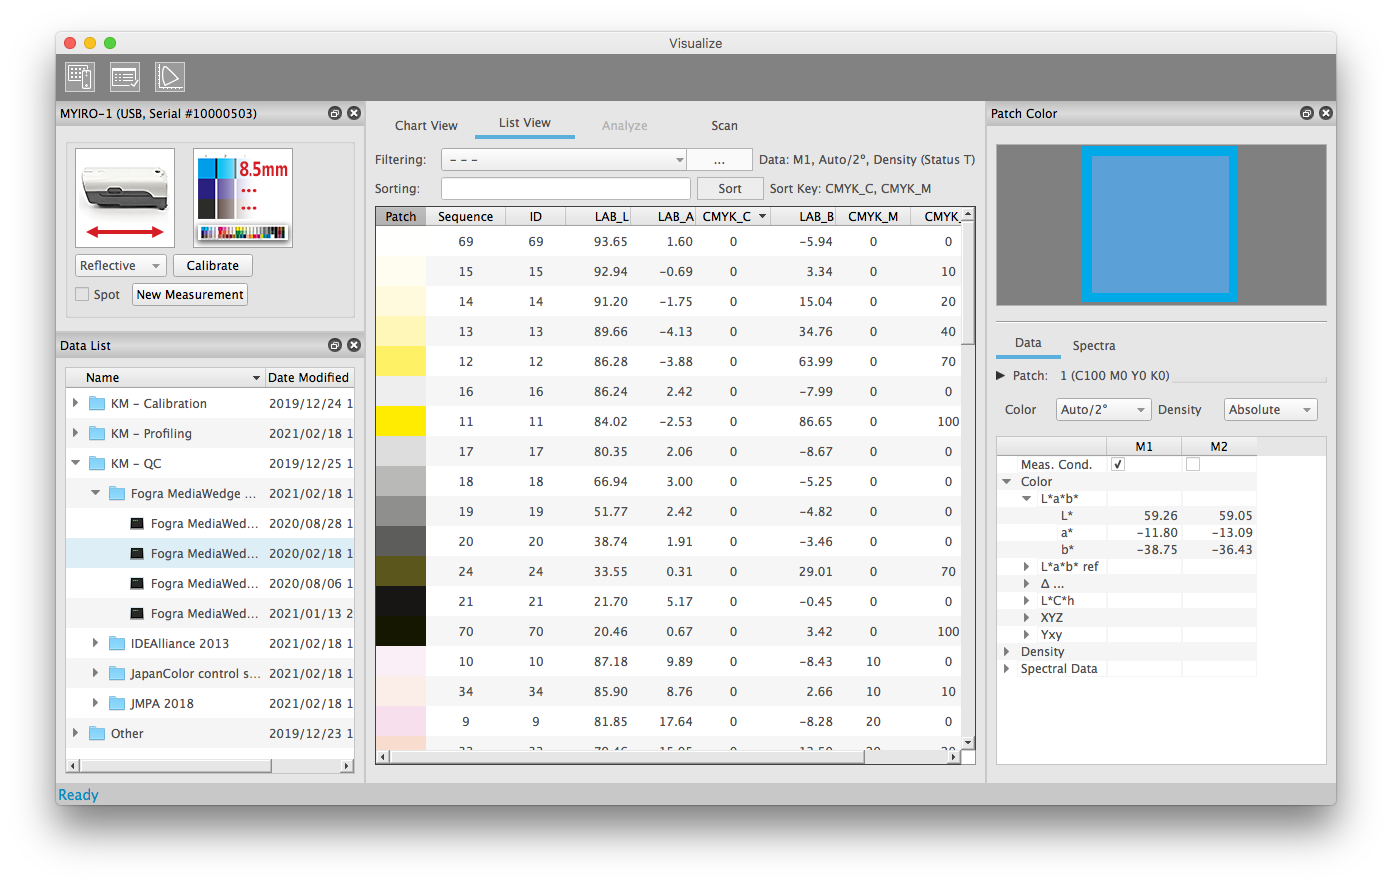
You can create more complex sortings by simply clicking multiple columns one after the other. "Sorted by" shows the last column clicked. Alternatively, you can specify a sorting order with several columns under "Sorting". Simply enter the values separated by commas. An input help makes the appropriate suggestions.At the end of the input, click on the "Sort" button to apply the sorting. "Sorted by:" now shows your active sorting. The sorting is in ascending order.
Filtering of measurement data
It is often difficult to find specific measurement fields in color management charts. This is especially true when charts have a scrambled layout. The filtering of the measuring fields helps here. For frequent searches such as paper, solids, linearization and gamut fields, AccurioPro ColorManager has predefined filters
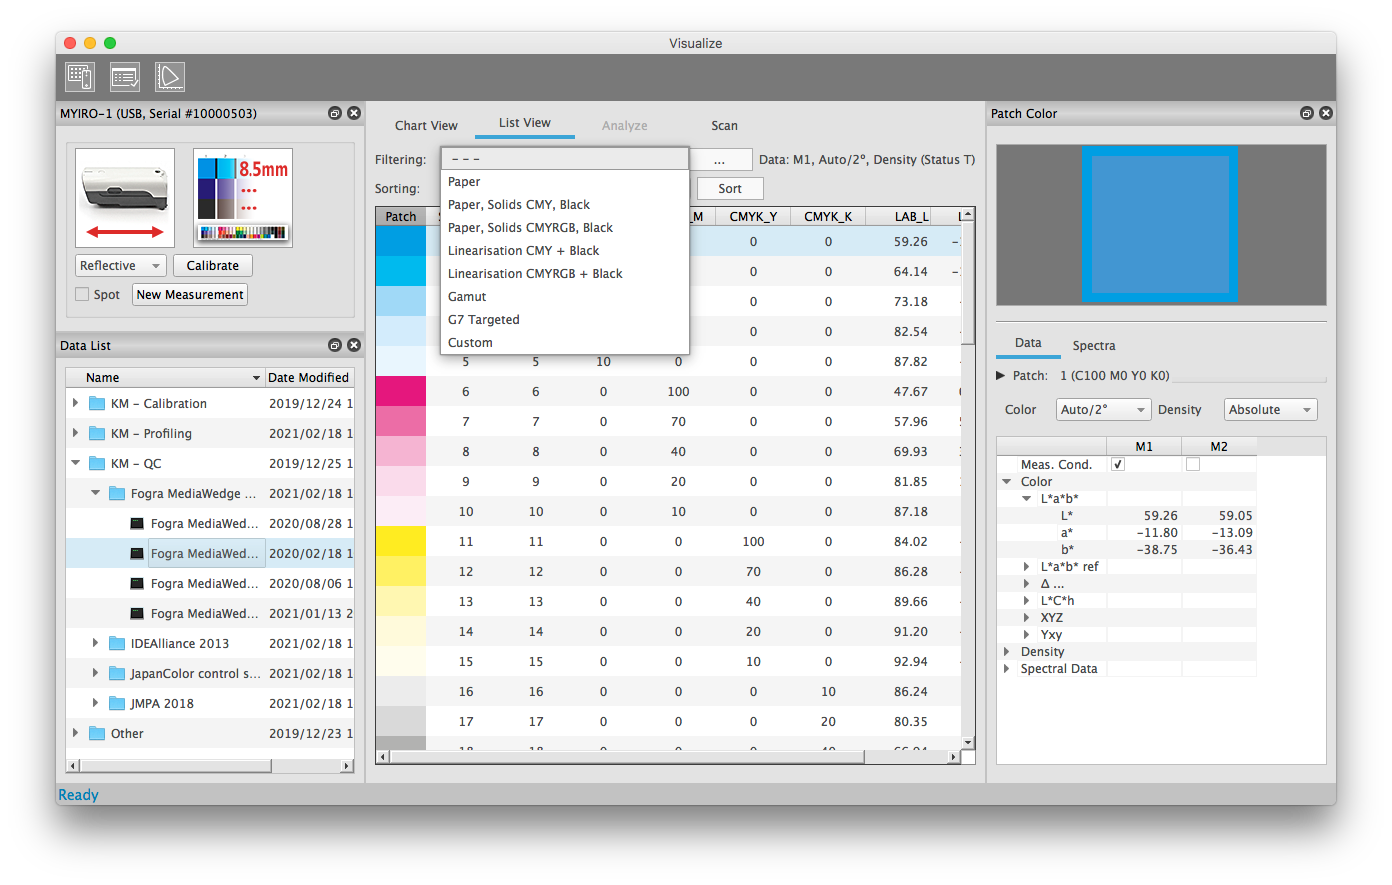
You can also create your own filtering.
To do so, click on the Filter Options button.
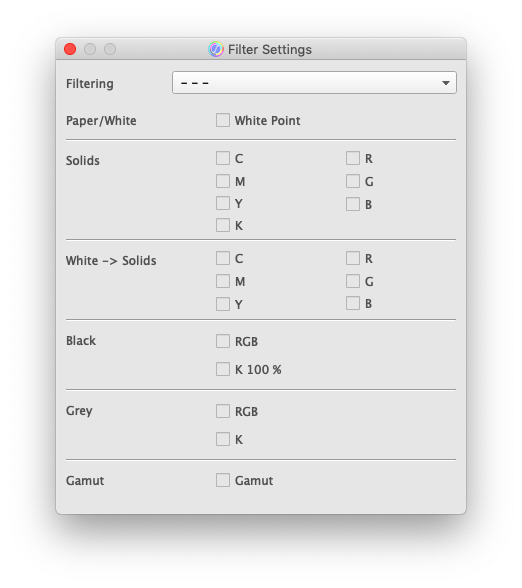
Here you can select functional fields. Filtering is generally performed using the field attributes. You can also display these attributes in a column in the “List View”
- paper / white
- solids
- gradients from white to solids (primary/secondary colors)
- black points
- grey patches
- gradients from black to full tones
- gamut patches
- further function fields
Most of the field attributes for the filtering result uniquely from the device values (CMYK or RGB) and are automatically determined from these values of the chart definition.
In addition, there are field attributes that have different device values from print standard to print standard (e.g. gray balance), or whose technical function is independent of the device value (e.g. uniformity or position check). These attributes must be specified in the chart definition in order to be filtered
Measurement window main area - Analyze
You can switch the “Analyze” tab on and off using the toolbar icon in the measurement window. You can select the analysis setting and, if necessary, your reference file here and receive the evaluation for the active measurement.
There are two ways to access the “Analyze” tool, depending on your preferred working method.
- A) You can first open the "View" or "Measure" tool, make or select a measurement there and then display the "Analyze" tab for evaluation.
This is the preferred procedure if you want to evaluate a measurement in detail according to different criteria. The status and criteria information on the “Analyze” tab is provided for this purpose. - B) Alternatively, you can start "Analyze" directly from the main window. The “Analyze” tab for selecting the analysis setting will then be displayed first. You can then select measurement datasets or perform measurements.
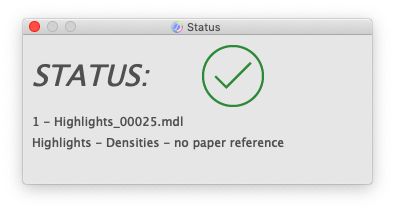
This is the preferred procedure if you want to analyze several measurement datasets according to the same evaluation rule. The overall status of a measurement is of particular interest here. This is displayed in the separate "Status" window in parallel to the tabs of the main area (Chart View, List View, Analyze, Scan).
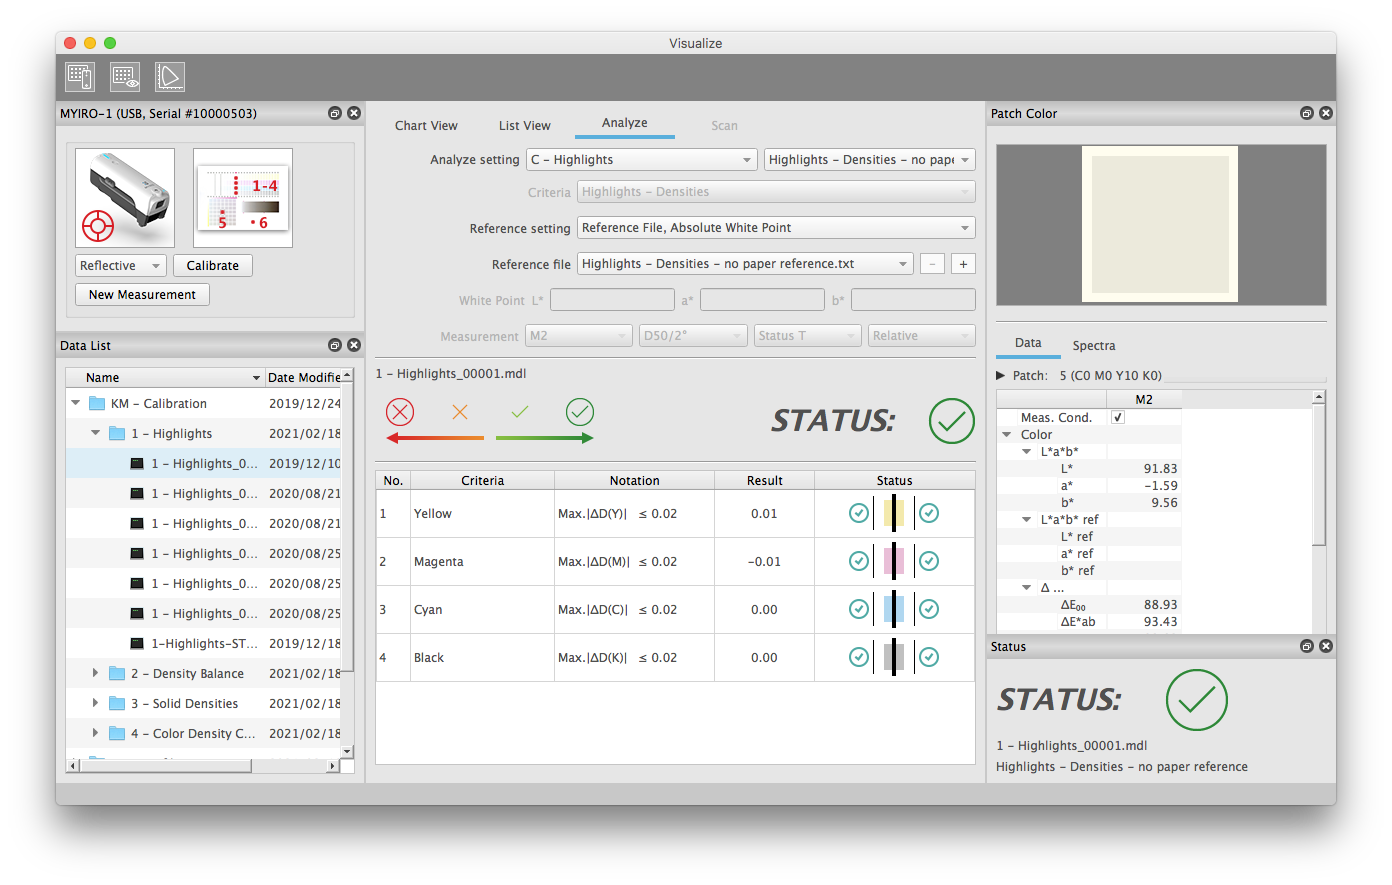
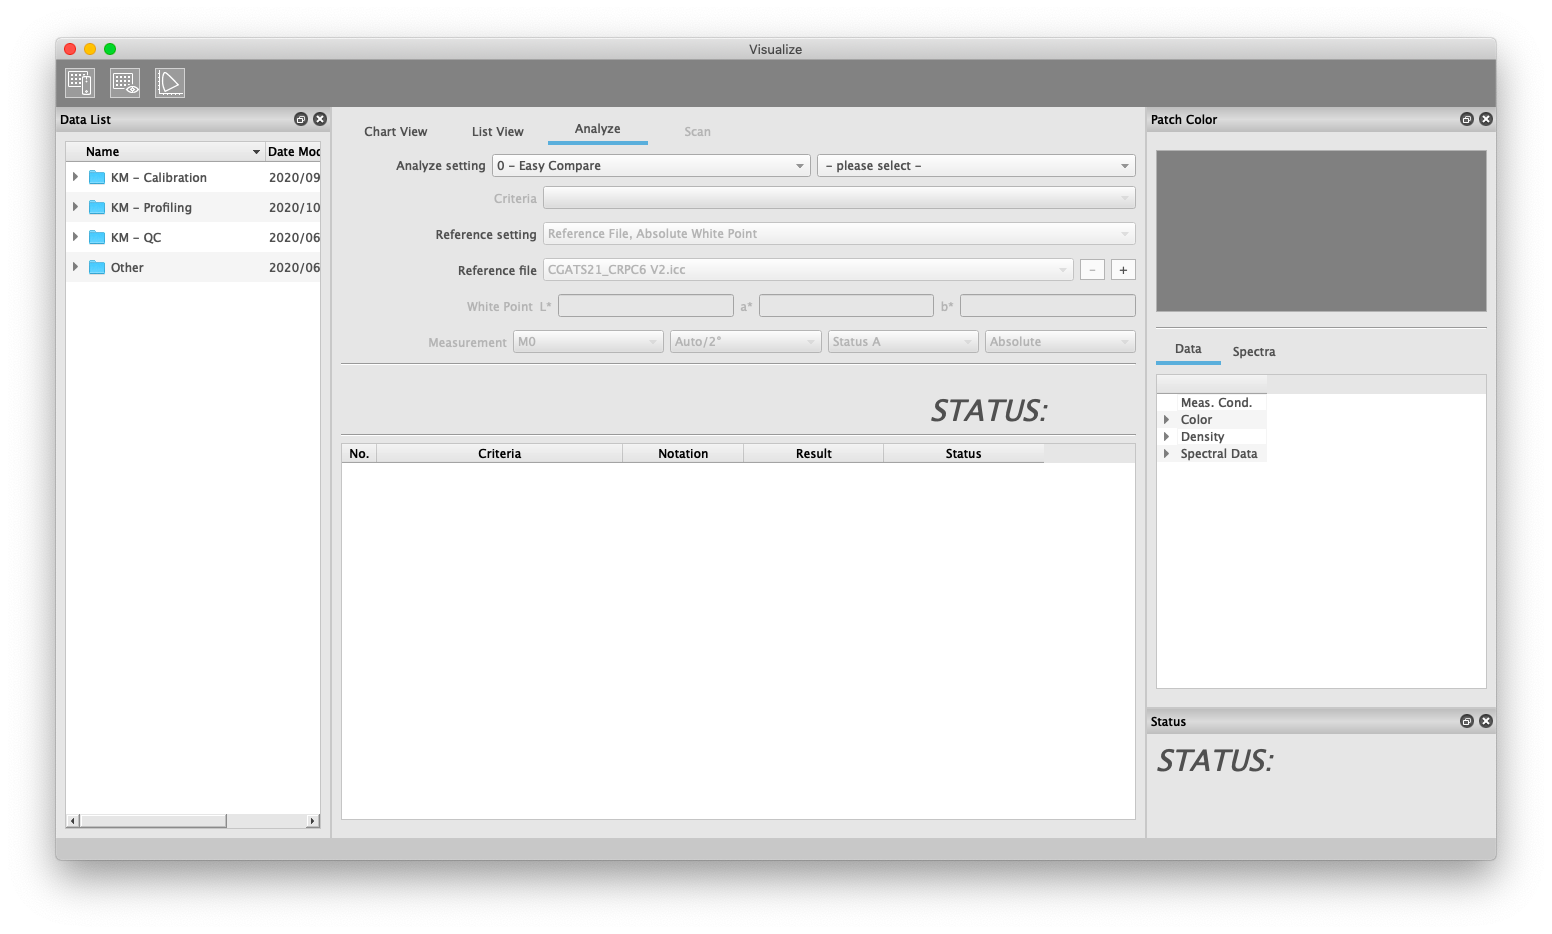
Detailed information on the parameters of Analyze can be found in Analyze.
Measurement Window Main Area - Scan
The “Scan” tab in the main area is only active for measurements made with the MYIRO-9(FD-9). Here you can see the black and white prescan of the MYIRO-9(FD-9) with the measurement positions of the color patches.
The measuring positions are displayed in the respective color of the measuring patch. Thus, the correct measuring position can be clearly checked, even if the pattern recognition of the MYIRO-9(FD-9) has detected a 180° rotation of the chart.
Depending on the size of your chart and your fields, please use the zoom slider to check the measuring positions.
If the "Verify Pattern Recognition" function (checkbox of “Verify”) is switched on by the user or in a chart definition, AccurioPro ColorManager stops after the prescan and first displays the scan tab for checking the determined measurement positions. By clicking on "Measure" in the "Device Settings" window, the measurement starts and the main area of the measurement window automatically switches to the Chart View tab.
Status
The small Status window is available when Analyze is enabled. It then displays the overall status of a measurement in parallel to the tabs in the main area.
If only the overall result of an evaluation is of interest, the user does not have to switch between the “Chart View” and “Analyze” tabs. The “Analyze2 tab is thus only required at the beginning of a measurement series for selecting the evaluation setting and for detailed analysis of the individual criteria in the case of color deviations above the tolerance limits.
Patch Color
The Patch Color window displays details of the measurement patch selected in the main area. The active measurement patch can be selected in the tabs “Chart View, “List View” or “Scan”.
On the other hand, the color parameters for the measurement values in the “List View” tab are also selected in the “Patch Color” Window, unless they are specified in an analysis setting.
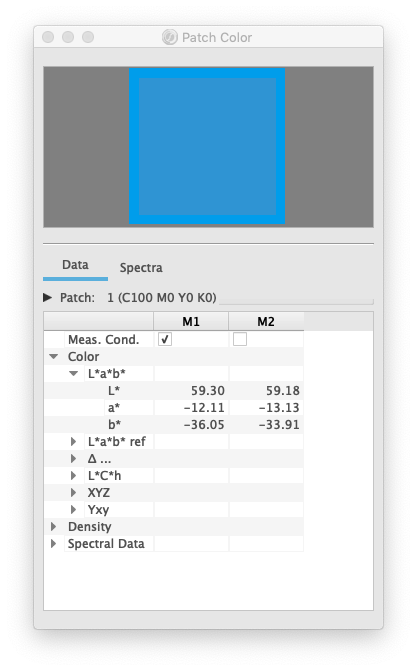
Visual Color Representation
This corresponds to the display in the “Chart View” tab. Depending on the situation, a unicolored field (chart definition) or a field with a frame is displayed (frame: expected color, inner area: measurement or checkerboard pattern).
Data
In the "Data" area, you can view all color data of the active measurement field.
Patch definition
The "ID" is the internal identification number of the patch, the "Sequence" shows the standard measurement order of the patches. Data output can be sorted by ID or sequence, depending on the export setting selected. You create manual sorts in the “List View” as described above. The header line shows ID and device values briefly in one line, the detail area also shows Sequence and, if available, the name and comment of the measurement patch.
Color values
In this table you can display all available color values of the measured patch. For simple measurements, you can freely select the parameters for measurement condition, observer and illuminant here. By right-clicking in the table header, you can display and compare several measurement conditions next to each other in columns. The checkbox "List View" controls which values appear in the tab "List View".
If the "Analyze" tab is active, the measurement conditions are permanently preselected in the evaluation setting and cannot be changed in the “Patch Color” window. The color parameter selection "Color" / "Density" is then not displayed, in the table you will also find various color difference values under "∆...".
The choice of the measuring condition indicates which light in the measuring instrument illuminates the printed sample. This influences the calculation of the measured spectrum due to different UV components.The choice of illuminant and observer for "Color", on the other hand, controls the calculation of the colorimetric values (XYZ, L*a*b*, ...) from the spectrum in the second step.
The settings "Auto/2°" and "Auto/10°" select as illuminant for M0/M1/M2 according to standard uniformly D50, for all other measuring conditions automatically the same illuminant as for the measuring condition. If, for example, you select D65 for measurement condition, an illumination using D65 in the measuring instrument is simulated and D65 is also automatically used for calculating the L*a*b* values. This is the only logical procedure with current measurement technology.
However, other combinations are still possible, since new measurement data may also have to be compared with old data. With old measuring instruments, for example, measurements used to be carried out frequently with halogen incandescent lamps (=> type of measurement light: incandescent lamp = standard illuminant CIE A). Nevertheless, different light types such as D65, D50, were used to calculate the L*a*b* values. As soon as a sample contains optical brighteners, this method generates false measurement data that no longer correspond to the visual observation. Nevertheless, new measurement data must partly be compared with old standards that have been defined in this way. Therefore, all combinations can be set in AccurioPro Color Manager.

 in the upper-right of a page, it turns into
  and is registered as a bookmark.