
Tool: Measure - Measurement of Charts
Introduction

The "Measure" tool is used to measure various charts. The chart selection is completely free when the "Measure" tool is called up directly by the user. If, on the other hand, the measurement is called via a workflow, the chart is usually predefined in the workflow.
Preinstalled are the charts for machine calibration, various profiling charts and several wedges for quality control.
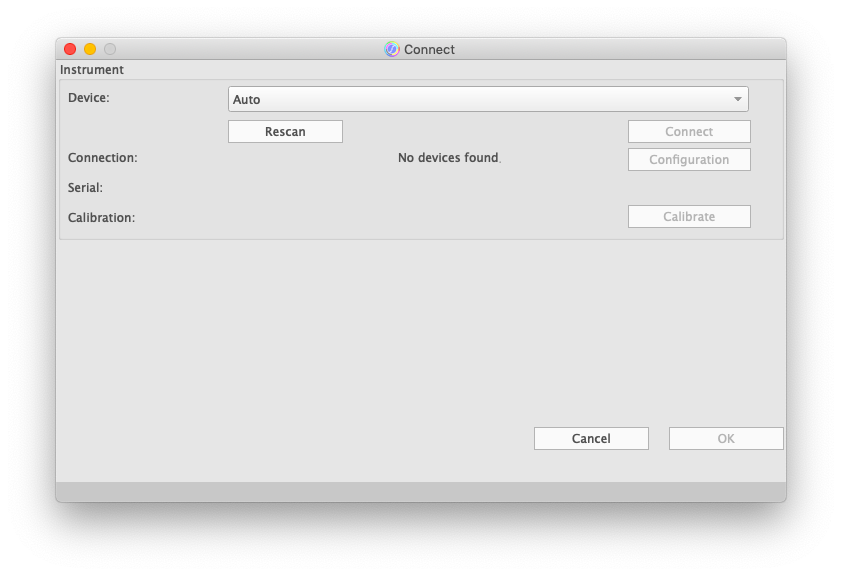
When this tool is called, the window for connecting to the measuring instrument appears first. AccurioPro ColorManager has interfaces to the following spectrophotometers:
Strip reader type (hand-held type) spectrophotometer: | |
|---|---|
MYIRO-1 | USB / Network (Wireless LAN) |
FD-7 / FD-5 BT | USB |
i1Pro / i1Pro 2 | USB |
Auto scan spectrophotometer: | |
|---|---|
MYIRO-9(FD-9) | USB / Network (Ethernet) |

Select the desired instrument connected to your computer from the “Device” list and connect it. AccurioPro ColorManager automatically tries to connect to the last device you used. You can also select the device yourself from the list and connect it with the "Connect" button. If your device is not yet displayed, you can select “Auto” or your desired instrument model from “Device” list and use the "Rescan" button to scan the connected instruments via USB ports and the network again.
- The MYIRO-9(FD-9) calibrates itself automatically at regular intervals during the measurement. No manual calibration is necessary for this instrument.
- For MYIRO-1 and i1Pro, attach the calibration cap (MYIRO-1) or the calibration plate (i1Pro) to the device and click on the "Calibrate" button in the “Connect” window.
- With FD-7 and FD-5BT you trigger the calibration on the instrument. Simply make a spot measurement on the calibration plate:
- Attach the target mask to the FD-7/FD-5BT.
- Place the measuring instrument on the calibration tile.
- Press the FD-7/FD-5BT down until calibration is complete.
After you have established the connection to a measuring instrument and the calibration has been completed, you can click the “OK” button. After clicking the “OK” button, measuring window is opened. Select the desired chart from “Data List” and perform the desired measurement.
After the measurement, the measurement data can be exported in various formats (see Data Export and Printing) or processed directly in AccurioPro ColorManager using the tools “Profiler” or “Analyze”.
Operation Example 1: Measurement of a profiling chart

- Start tool "Measure", connect one of desired measuring instruments and calibrate it if necessary.
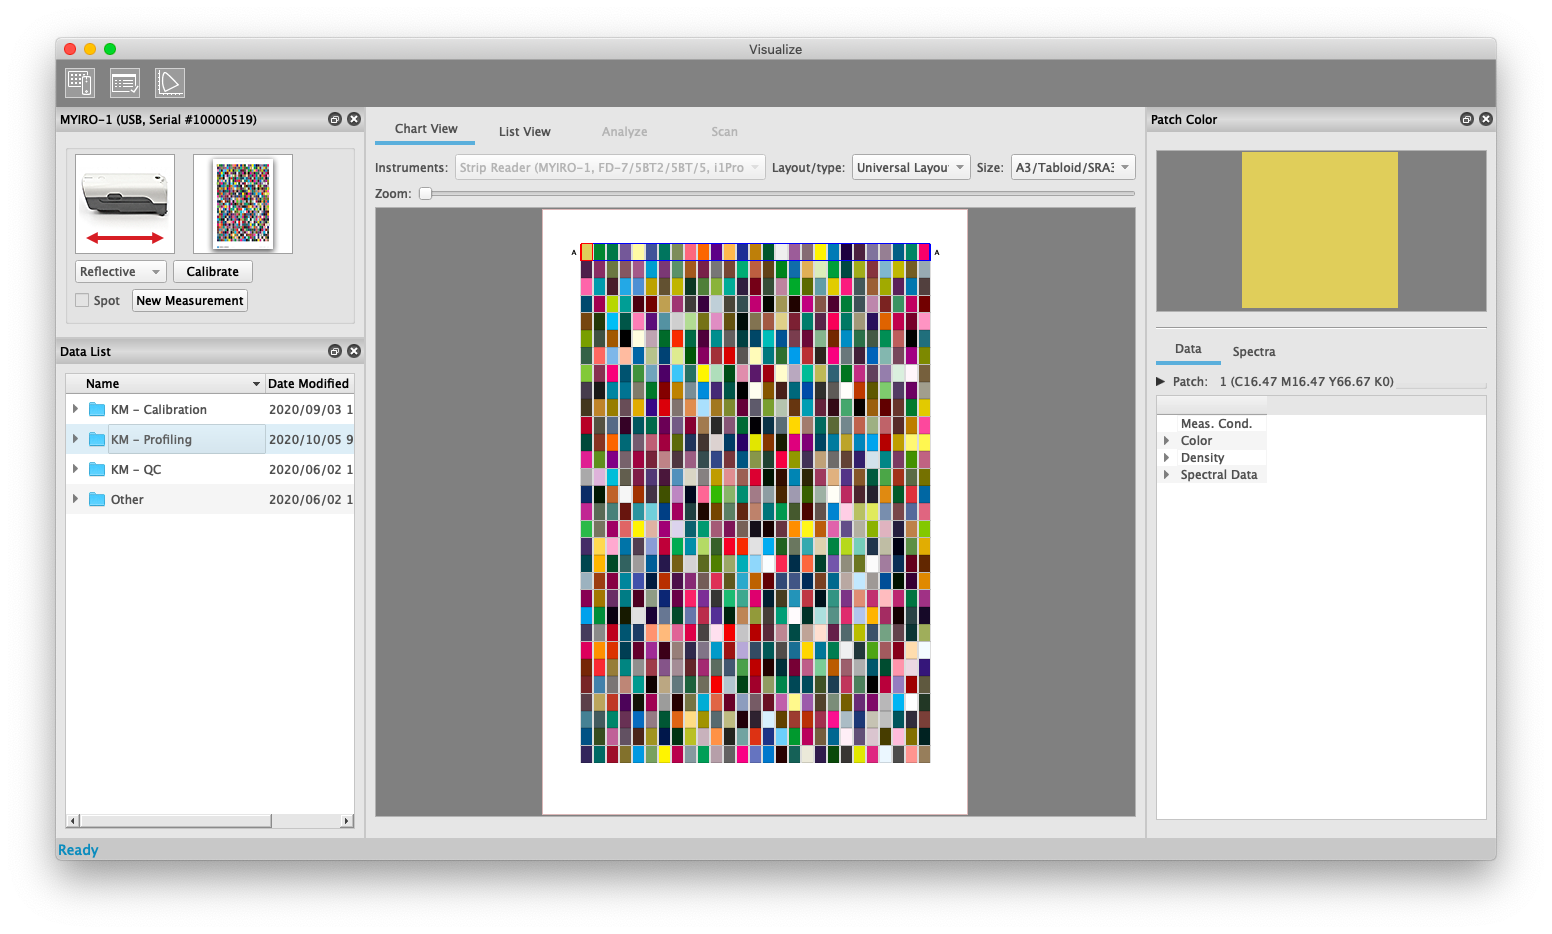
- In the “Data List” window, select the measurement folder “Profiling”. This measurement folder contains the CMYK-810 profiling chart. This chart has a universal layout, suitable for both strip readers (MYIRO-1, FD-7, FD-5BT, i1Pro) and the MYIRO-9(FD-9). For large paper formats this chart is available on one page, for small paper formats a two-page version is included.
The connected measuring device and universal layout are already preselected when you click on this measuring folder. Now select the desired paper size from the “Size” list. - The suitable PDF for printing the chart is now available from the menu. "File -> Open Printfile...". Now print this file with your printing system. When creating a new ICC profile, make sure that profile conversion is deactivated for this profiling printout.
- Measure your printout with your measuring device. Konica Minolta measuring instruments always capture all measurement conditions such as measurement condition M0, M1, M2, etc. You can therefore change the desired parameters in the "Patch Color" window at any time even after the measurement.
- After the measurement, start the Profiler of AccurioPro ColorManager via the Profiler icon in the toolbar at the top. This opens the “Profiler” window and transfers a measurement file with the active measurement parameters. In the Profiler window you can then select the further settings for the profile calculation (see Tool: Profiler). If you want to use an external program to calculate the ICC profile, you can alternatively export a CGATS measurement file after the measurement (see Data Export).
Further details on operation can be found in Tools.
Operation Example 2: Measurement of a quality assurance chart

- Start "Measure" tool, connect one of the instruments and calibrate it if necessary.
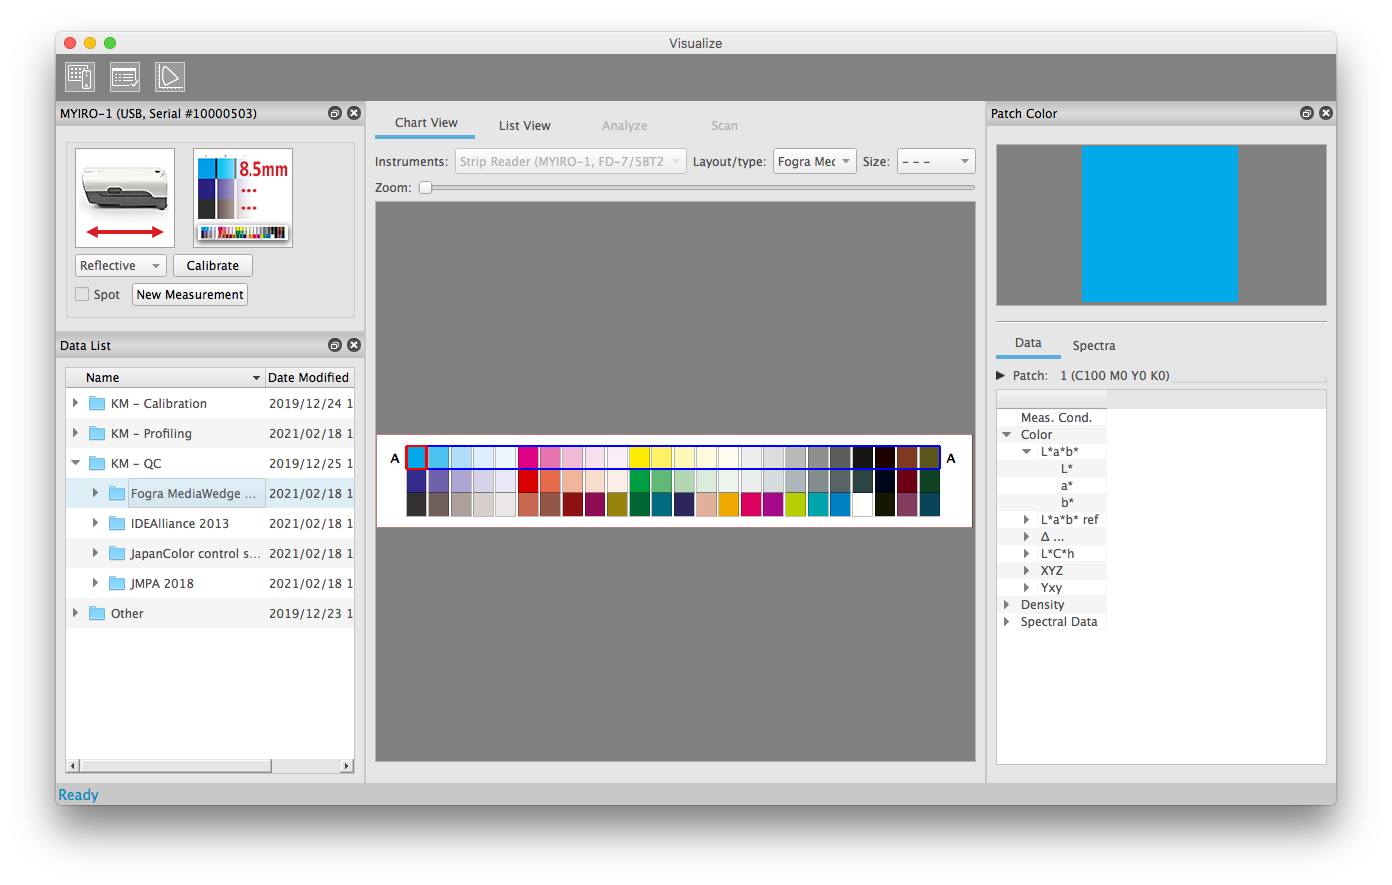
- In the "Data List" window, select the "QC\Fogra MediaWedge 3.0" measurement folder. This measurement folder contains various layouts of the Fogra Media Wedge.
The connected measuring device is already selected. Depending on the measuring device, you can select the compatible layouts from “Layout/Type” list. Depending on the selected layout, strip readers, hand-held measuring devices are also automatically set to spot measurement or strip measurement. - If you need a media wedge print file for placement on your test print, you can save this via the menu "File -> Open Printfile...".
- Measure your printout with your measuring device.
- After the measurement, start the “Analyze” tool for evaluation and select the desired evaluation parameters (see Tool: Analyze).
Further details on operation can be found in Tools.
 in the upper-right of a page, it turns into
  and is registered as a bookmark.