

[Image Diagnosis]
Overview
Machines mounted with Intelligent Quality Optimizer IQ-501 can run a diagnosis to find the causes of various defects on images including lines and spots (white and colored outlines, black and white blots and marks) using the [Image Diagnosis] feature. You can then make various adjustments based on the results of the diagnosis to try and improve the stability of the image quality.
It is recommended that you perform Image Diagnosis once per day after powering-on the system. If set to [Auto Run], this is performed automatically once per day.
- [Simple Diagnosis]
Output the horizontal, vertical band charts and basic image diagnosis chart from the device and perform [Simple Diagnosis] using Intelligent Quality Optimizer IQ-501. - [Detailed Diagnosis]
Output a detailed diagnosis items chart from the device, perform [Detailed Diagnosis] using Intelligent Quality Optimizer IQ-501, and if any abnormalities in the images are found, adjust accordingly.
- For machines not mounted with Intelligent Quality Optimizer IQ-501, the [Image Diagnosis] option is not displayed. [Image Diagnosis] is not displayed in the default state. To use this setting, please contact your service representative.
Chart Types and Number of Output Sheets for [Simple Diagnosis]
Chart type | Sheet |
Horizontal band chart | 1 sheet |
Vertical band chart | 1 sheet |
Basic image diagnosis chart | 1 sheet |
Chart Types and Number of Output Sheets for [Detailed Diagnosis]
Details of [Vertical Streak Diagnosis] *1 | Types of Full Area Charts and Number of Output Sheets | |||||||||||
Halftone 1-sided | Solid 1-sided | Simplex | ||||||||||
Y | M | C | K | Y | M | C | K | Y | M | C | K | |
Common Vertical Streak Diagnosis | 1 sheet | 1 sheet | 1 sheet | 1 sheet | - | - | - | - | - | - | - | - |
Single-Color Vertical Streak Diagnosis | 2 sheets | 2 sheets | 2 sheets | 2 sheets | 1 sheet | 1 sheet | 1 sheet | 1 sheet | 2 sheets | 2 sheets | 2 sheets | 2 sheets |
*1: Only output to perform Detailed Diagnosis when an error is detected by Simple Diagnosis.
Details of [HorizontalStreakDiagnosis] | Types of full area charts (1-sided) and number of output sheets | |||
Halftone | ||||
Y | M | C | K | |
Horizontal streak diagnosis | 6 sheets | 6 sheets | 6 sheets | 6 sheets |
Details of [Spot Diagnosis] | Types of full area charts (1-sided) and number of output sheets | Types of full area charts (2-sided) and number of output sheets | ||||
Halftone | Blank page | Halftone | ||||
Y | M | C | K | M | ||
Spot Diagnosis | 6 sheets | 6 sheets | 6 sheets | 6 sheets | 6 sheets | - |
- [Image Diagnosis] is not displayed by default. To use this setting, please contact your service representative.
- The image error detection level can be changed for image diagnosis. For details, contact your service representative.
- When the image analysis and diagnosis are completed, "diagnosis analysis data" and "diagnosis scan image data" are generated. The generated diagnosis data can be sent to the service representative as a log. For details about sending logs, refer to [Error Image Send Permission], or contact your service representative.
- The number of charts output for each diagnosis is included in the print count.
[Image Diagnosis]: [Basic Setting]
Configure the settings so that [Simple Diagnosis] and [Detailed Diagnosis] are linked together.
In [DetailedDiagnosis/Sync.SimpleDiagnosis], select [ON] to perform [Detailed Diagnosis] automatically when an abnormality is detected.
Video of Procedure
Procedure
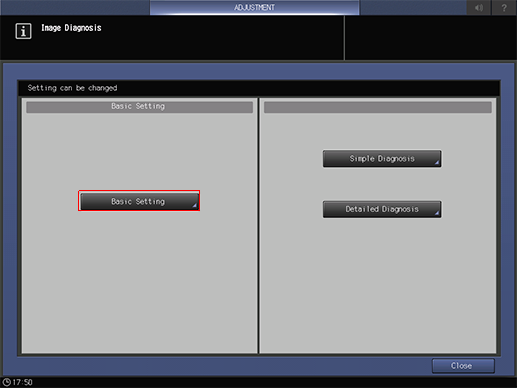
Press [Basic Setting].
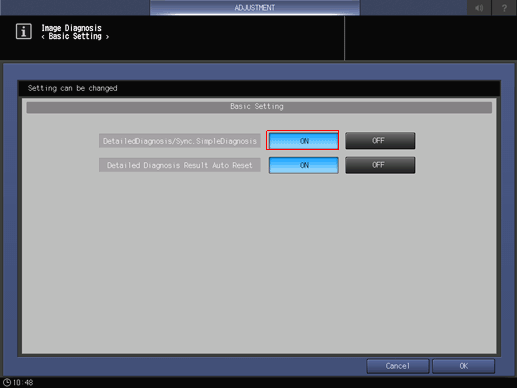
Change [DetailedDiagnosis/Sync.SimpleDiagnosis] to [ON].
Perform [Detailed Diagnosis] automatically when an abnormality is detected.
[Image Diagnosis]: [Simple Diagnosis]
Output horizontal and vertical band charts and perform simple [Image Diagnosis] using Intelligent Quality Optimizer IQ-501.
Video of Procedure
Procedure
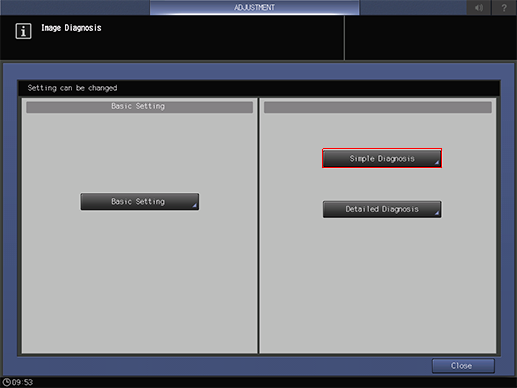
Press [Simple Diagnosis].
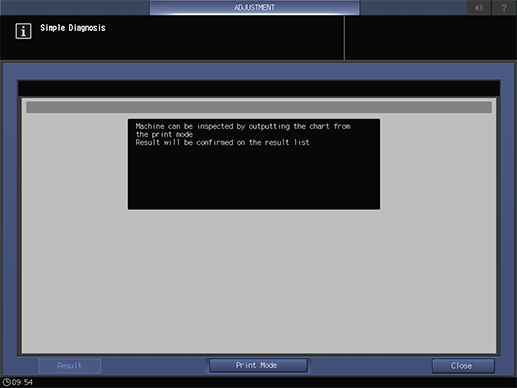
Press [Print Mode].
Select the paper size for the chart.
Load paper with a width of 279.4 mm or more, and a length of 420.0 mm to 487.7 mm, into the tray, and select the button for that tray.
Press Start on the Control panel.
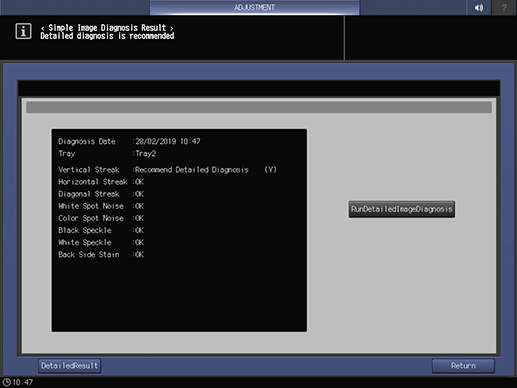
A single copy of the horizontal band chart and a single copy of the vertical band chart are output, and the [< Simple Image Diagnosis Result >] is displayed.
Press [RunDetailedImageDiagnosis] to perform [Detailed Diagnosis] for the items diagnosed as [Recommend Detailed Diagnosis].
- Press the [Result] button on the [Simple Diagnosis] screen to display the latest [< Simple Image Diagnosis Result >].
[Image Diagnosis]: [Detailed Diagnosis]
Output the [Detailed Diagnosis] chart and perform a detailed [Image Diagnosis] using Intelligent Quality Optimizer IQ-501. The adjustments are performed automatically if an abnormal image is generated.
Video of Procedure
Procedure
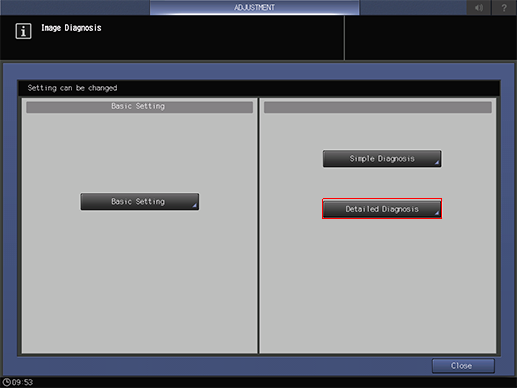
Press [Detailed Diagnosis].
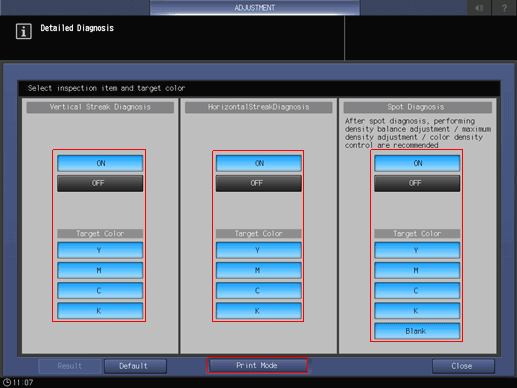
Select the item you want to diagnose and press [Print Mode].
After selecting [ON] for the diagnosis item, select at least 1 color for [Target Color].
If Default is selected, [ON] and [Target Color] are selected for each diagnosis item.
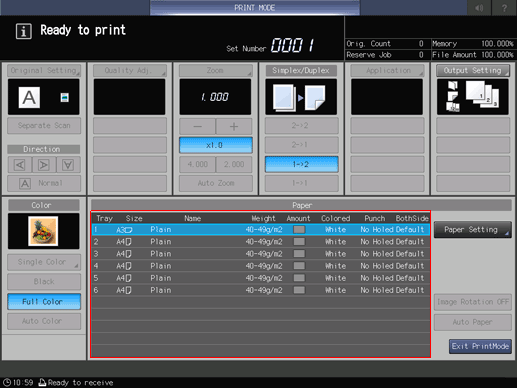
Select the paper size for the chart.
Load paper with a width of 279.4 mm or more, and a length of 420.0 mm to 487.7 mm, into the tray, and select the button for that tray.
Press Start on the Control panel.
The chart for the diagnosis items selected in Step 3 is output, and the [Detailed Diagnosis Result] is displayed.
[Autocorrection finish]: Item with diagnosis completed. Check the output paper.
[Undiagnosed]: Those diagnosis items not selected in Step 3.
The diagnostic analysis data and diagnostic scan image data are generated once the image analysis and diagnosis is complete. The generated diagnostic results are sent to the relevant service center as a log if permitted to do so in the settings. For details about sending logs, refer to [Error Image Send Permission], or contact your service representative.

Check the image quality by outputting an AQA Reference chart.
- Press the [Result] button on the [Detailed Diagnosis] screen to display the latest [Detailed Diagnosis Result].


 in the upper-right of a page, it turns into
  and is registered as a bookmark.